

Warrant hedging strategy is one of the most overlooked approaches in retail investing a method that has historically delivered 25% annual returns with remarkably low risk, through bull markets, bear markets, crashes, and recoveries.
Most investors have never heard of it. The ones who have tend to assume it’s too complex. It’s not. The logic is surprisingly clean, the mechanics are learnable in an afternoon, and the historical record spanning 17 years of live data is difficult to argue with.
This is a complete guide to warrant hedging: what it is, how it works, the exact rules for selecting positions, and why it consistently outperformed both buying stocks and selling short alone.
What Is a Warrant?
Before understanding the hedging strategy, you need to understand warrants.
A warrant is an option to buy a company’s common stock at a fixed price (the exercise price) at any time before a specific expiration date. If you hold a warrant that allows you to buy one share of XYZ at $25, and XYZ is currently trading at $30, your warrant has immediate real value: you can exercise it to buy at $25 and sell immediately at $30.
Warrants are different from the common stock itself in 3 important ways:
1. Leverage. Warrants rise and fall faster than the underlying stock. When the stock moves up 10%, the warrant might move up 30-50%. This leverage works in both directions: spectacular gains, or catastrophic losses.
2. Expiration. Unlike a stock, a warrant has an expiration date. After that date, it’s worthless. This is the critical mechanic the hedging strategy exploits.
3. Time value decay. As a warrant approaches its expiration date, its value tends to fall especially if the stock is trading near or below the exercise price. The time value evaporates as the deadline approaches.
Tri-Continental Corporation warrants illustrate both extremes. Purchased for 3 cents in 1942, they reached $55 by 1946 a 187.5× return that turned $1,000 into $187,500. But Universal Pictures warrants went the other direction: worth $39 in 1945, they fell to $1.50 two years later.
The question is: can you capture the upside while protecting against the downside? The warrant hedge says yes.
The Two Basic Rules of Warrant Pricing
Before building a hedge, you need to understand what determines warrant prices. Two rules govern every warrant, every day.
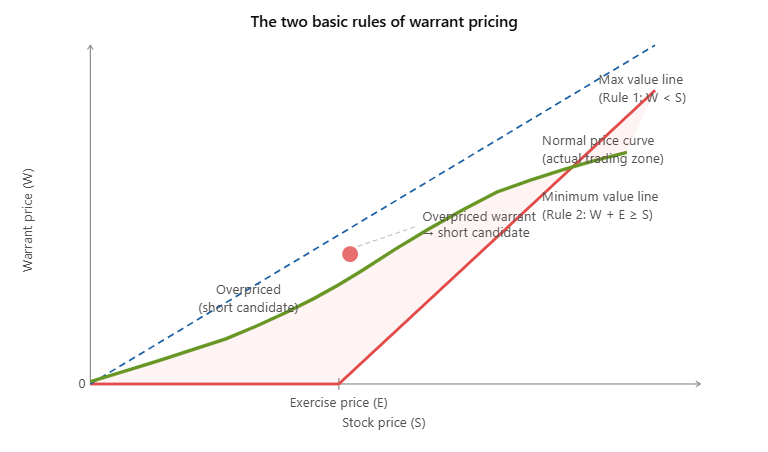
Rule 1: The warrant price must be less than the stock price.
A warrant is an option to buy the stock. It has no dividend rights. It has no voting rights. It’s simply the right to purchase the stock at a price. Since an investor would almost always prefer to own the actual stock rather than an option on it, the warrant must trade below the stock price.
Rule 2: Warrant price plus exercise price must be at least as large as the stock price.
If the exercise price is $25 and the stock is at $40, the warrant cannot trade for less than $15. Why? Because anyone could buy the warrant at $14, pay $25 to exercise it, and sell the resulting stock at $40 for an immediate $1 profit. This arbitrage opportunity disappears almost instantly as traders exploit it, which forces the warrant price back above the minimum.
These 2 rules define the boundaries in which all warrant prices must trade. Within those boundaries, the actual warrant price depends on the stock price, the time remaining to expiration, volatility, and investor sentiment. Overpriced warrants those trading above what fair value calculations suggest are the primary target of the hedging strategy.
Why Short-Term Warrants Are Almost Always Overpriced
The historical data across 11 listed warrants held from 18 months before expiration to 2 months before expiration tells a stark story:
Table 1: Historical Results of Buying Short-Term Listed Warrants
| Company | Gain or Loss (16 months) |
|---|---|
| International Minerals and Chemicals | +66.3% |
| Richfield Oil Corp. | -60.0% |
| Manati Sugar | -94.8% |
| Pan American Airways | -98.4% |
| Pennsylvania Dixie Cement | -57.1% |
| Radio-Keith-Orpheum | -99.2% |
| Colorado Fuel and Iron | -92.4% |
| ACF Brill | -75.1% |
| Molybdenum | -81.4% |
| Armour | +36.0% |
| General Acceptance | +50.0% |
| Average 16-month loss from buying | -46.0% |
| Average gain from selling short | +46.0% |
| Average annual return from short sales | +34.5% |
Warrant buyers lost an average of 46% over 16 months. The mirror image selling those same warrants short would have returned 46% in 16 months, or 34.5% annually without margin leverage.
The reason is fundamental: investors chronically overpay for the lottery ticket effect of warrants. They see the potential for spectacular leverage gains and pay a premium that the mathematics simply doesn’t support. As expiration approaches and the time value erodes, the overpriced warrants fall often catastrophically.
But selling warrants short carries its own risk. If the stock rises dramatically, the warrant rises with it and the short seller faces unlimited losses. This is where the hedge comes in.

The Basic System: Combining Short Warrants With Long Stock
The hedge works by simultaneously selling overpriced warrants short and buying the underlying common stock. The two positions have roughly offsetting risk.
Here’s why: a stock and its warrant tend to move up and down together. When the stock rises, the short warrant position loses money but the long stock position gains money. When the stock falls, the stock position loses but the short warrant position gains as the warrant price falls. The risks partially cancel.
What remains after the cancellation? A residual profit from the overpricing of the warrant. That overpricing gets squeezed out over time regardless of where the stock goes.
A concrete example
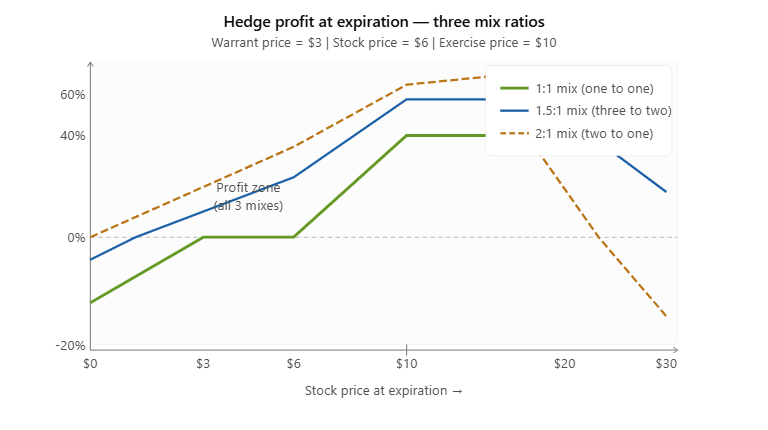
Suppose a company’s warrant expires in 18 months and allows purchase of one share at an exercise price of $10. The warrant is currently trading at $3 and the stock at $6.
You sell short 100 warrants (receiving $300) and buy 100 shares of stock (paying $600), for a total investment of approximately $720 (with margin).
Now let’s trace the outcomes at expiration, depending on where the stock finishes:
Table 2: Basic System Profit at Various Stock Prices
| Stock Price at Expiration | Profit on 100 Common | Profit on 100 Warrants Short | Total Profit |
|---|---|---|---|
| $0 (worst case) | -$600 | +$300 | -$300 |
| $3 (breakeven on stock) | -$300 | +$300 | $0 |
| $6 (unchanged) | $0 | +$300 | +$300 |
| $10 (at exercise price) | +$400 | +$300 | +$700 |
| $20 (doubles) | +$1,400 | -$700 | +$700 |
| $50 (huge rise) | +$4,400 | -$3,700 | +$700 |
The results are striking. When the stock is above the exercise price, profit is capped at $700 regardless of how high the stock goes because warrant gains offset stock gains above $10. But when the stock stays flat or falls moderately, the warrant’s time value decay generates solid profits.
The only losing scenario is a steep stock decline below $3, which is a 50% collapse in 18 months. Even then, the maximum loss is limited to $300, less than half the typical gain.
This is not a prediction of stock prices. It’s a mathematical structure that generates profit from warrant overpricing across a wide range of market outcomes.
The Avalanche Effect: Compounding Profits as Warrants Fall
When warrants decline in price, margin requirements on the short position decrease, releasing capital that can be reinvested into additional short positions. This creates a compounding avalanche of profit.
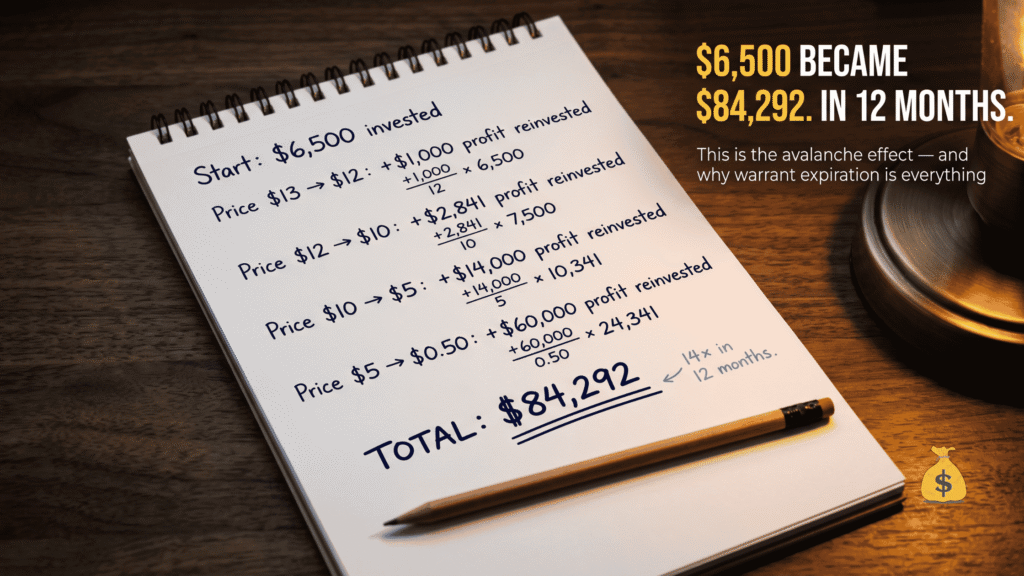
The Molybdenum warrant example demonstrates this dramatically. Starting with an initial investment of $6,500 to short 1,000 warrants at $13, the avalanche effect over 12 months as prices fell from $13 to $0.50 would generate profits exceeding $84,000.
Table 3: The Avalanche Effect in Action
| Price | Total Warrants Short | Increase in Profit | Additional Warrants Added |
|---|---|---|---|
| $13 (start) | 1,000 | — | — |
| $12 | 1,250 | $1,000 | 250 |
| $11 | 1,591 | $1,250 | 341 |
| $10 | 2,068 | $1,591 | 477 |
| $8 | 2,978 | $2,482 | 496 |
| $6 | 4,289 | $3,574 | 715 |
| $4 | 7,721 | $4,289 | 2,574 |
| $2 | 21,618 | $9,008 | 3,603 |
| $0.50 | 30,265 | $15,133 | End |
| Total profit | $84,292 |
An initial $6,500 investment became $84,000 a 14-fold increase in 12 months. The warrants fell nearly to zero as expiration approached, exactly as mathematics predicted they would when overpriced short-term warrants approach their expiration date.
Note that the avalanche effect substantially increases risk as well as profit. A sudden reversal in price can result in losses that compound as quickly as the gains.
The Warrant-Stock Diagram: Visualising Positions
The warrant-stock diagram is the core analytical tool for selecting and managing hedge positions. It plots the warrant price (vertical axis) against the stock price (horizontal axis), allowing visual identification of overpriced warrants and optimal mix selection.
Every warrant has a “normal price curve” for each time to expiration. A warrant trading above its normal price curve is overpriced a prime candidate for the short side of the hedge. A warrant trading on or below its normal price curve is fairly priced or underpriced and should be avoided.
Normal price curves drop lower as expiration approaches. A warrant that is 24 months from expiration with the stock at the exercise price typically trades at around 43% of the exercise price. The same warrant with only 6 months remaining might trade at 18% of the exercise price. This downward drift in the normal price curve is the mathematical foundation for the hedge’s profitability.
Table 4: Normal Warrant Prices at Various Times to Expiration
| Months to Expiration | Stock at 50% of Exercise Price | Stock at Exercise Price | Stock at 150% of Exercise Price |
|---|---|---|---|
| 24 months | 14% of exercise price | 43% of exercise price | 75% of exercise price |
| 18 months | 10% | 36% | 68% |
| 12 months | 7% | 26% | 59% |
| 6 months | 3% | 16% | 48% |
| 1.5 months | 0% | 5% | 38% |
Warrants trading significantly above these normal prices (on or above the normal price curve in the warrant-stock diagram) are overpriced and are candidates for the short side of the basic system.
How to Select Warrant Hedge Candidates: The Step-by-Step Process
Applying the basic system requires following a specific selection process. Here are the rules:
Step 1: Identify all listed warrants.
Focus on warrants listed on major exchanges. Over-the-counter warrants can be used but are harder to sell short reliably. Check financial publications daily for warrants listed with “wt.” after the company name.
Step 2: Limit to warrants expiring in less than 4 years.
Short-term warrants decline faster than long-term ones. The profit opportunity is concentrated in this window.
Step 3: Eliminate warrants where the stock trades above 1.2 times the exercise price.
When the stock is well above the exercise price, the warrant has significant intrinsic value and is unlikely to be overpriced. Shorting it carries too much risk if the stock continues rising.
Step 4: Eliminate warrants trading below 6% of the exercise price.
There’s little premium left to squeeze out of a warrant already near zero.
Step 5: Avoid warrants with large short interest or approaching exchange bans.
Exchanges sometimes ban short sales on specific warrants a few months before expiration, forcing short sellers to cover early. Check for existing large short positions that might trigger a short squeeze.
Step 6: Using the warrant-stock diagram, identify which remaining warrants trade above their normal price curve.
These overpriced warrants are your primary candidates. The further above the normal price curve, the greater the expected profit.
Step 7: Determine the mix — warrants short per share of stock long.
The mix determines the balance of risk between upside and downside protection. The general rule: when the stock is between 30% and 120% of the exercise price, use a mix of 3 warrants short per 1 share long. When stock is below 30% of exercise price, short the warrants without buying common (they’re almost certainly expiring worthless). Above 120% of exercise price, avoid the system entirely.
Step 8: Divide capital among 2-3 candidates when available.
Concentration creates the most profit potential. But when several equally attractive situations exist, splitting capital among them reduces risk.
The 17-Year Historical Record
The most compelling evidence for the basic system is the 17-year historical record from 1946 to 1966.
Applying a simplified mechanical strategy selecting the best listed warrant candidates at each point in time, using a 3-to-1 mix, entering and exiting as each warrant neared expiration produced the following results:
Table 5: Basic System Performance 1946-1966 (Simplified Mechanical Strategy)
| Strategy | Starting Capital | 17-Year Result | Average Annual Return |
|---|---|---|---|
| Basic system (hedge) | $1,000 | $50,000+ | 25-26% per year |
| Selling warrants short only | $1,000 | $22,000 | ~20% per year (highly erratic) |
| Buying common stock only | $1,000 | $2,200 | ~5% per year |
The hedge outperformed selling short alone by 2.8 times. It outperformed buying stock alone by more than 22 times.
During the period 1956-1960, no listed warrants met the criteria, so the system was idle. For the 17 years it was actually active, the annual return averaged 26% compounded before taxes. After a flat 25% tax on profits, it averaged 22% compounded.
Critically, this record includes the 1962 market crash (down 26% in 3.5 months) a period when most investors were losing heavily. The hedge continued generating profits because the short warrant position gained while the common stock fell, nearly offsetting each other.
Live Trading Results: $100,000 Doubled in Four Years
The theoretical historical record is one thing. The live trading results over 5 years are another.
Operating primarily in three situations Molybdenum warrants, Bunker-Ramo (Teleregister) warrants, and Sperry Rand warrants actual invested capital generated total net profits of approximately $66,200. Adding smaller positions in National Tea, Universal American, Pacific Petroleum’s, and Realty Equities brought total profits to approximately $85,000 over five years, representing more than 25% per year compounded.
The Molybdenum position alone returned 42% annually over 16 months. The Bunker-Ramo position returned approximately 120% annually over 26 months. The Sperry Rand position returned 23% compounded annually over 47 months.
What’s notable about these results is their source: they came not from predicting which direction the stock would move, but from correctly identifying overpriced warrants and constructing mathematically sound hedges. The stock could move up, down, or sideways. Within a wide range of outcomes, the hedge generated profit either way.
Common Risks to Understand
No system is without risk. The basic system has specific vulnerabilities that every practitioner needs to understand before committing capital.

Short squeezes
A short squeeze occurs when a single investor or group acquires a large position in warrants and then demands return of borrowed certificates. Short sellers are forced to buy the warrant at whatever price the controlling party demands.
The Molybdenum warrant experienced this in 1962. International Mining acquired 36,300 warrants (about 20% of outstanding) and pushed the price from 16 to 25 in weeks, before the position unwound and warrants fell back to single digits.
The defense: monitor short interest in any warrant you’re short. Avoid warrants with large existing short positions relative to outstanding warrants. Maintain enough margin cushion to survive a temporary squeeze without being forced to cover at the worst prices.
Exchange bans on short sales
Exchanges sometimes ban short sales on specific warrants in the months before expiration, particularly if short interest is high. This forces short sellers to cover early, potentially reducing profits significantly.
The solution: focus on warrants with more than 6 months to expiration and be aware of existing short interest levels before entering.
Volatile price movements
The hedge protects against moderate price moves. Catastrophic moves a stock falling 70%+ in a short period, or rising 300%+ can produce losses even with the hedge in place. Diversifying across 2-3 positions simultaneously reduces this risk significantly.
Margin calls
As warrants occasionally spike against your position, margin calls may require depositing additional capital on short notice. Keeping 20-25% of your capital as a cash reserve specifically for margin emergencies is essential.
Extending to All Convertible Securities
The same hedging logic applies to a much wider universe than just warrants. Any security that can be converted into common stock carries the same mathematical structure and can be hedged the same way.
Convertible bonds: bonds that can be exchanged for common stock. The conversion ratio, like an exercise price, sets the relationship between bond and stock values. Overpriced convertibles can be shorted while the common is held long.
Convertible preferred stocks: preferred shares that convert to common at a specified ratio. Same mechanics as convertible bonds.
Call options: the right to buy a stock at a specific price before a specific date. Mathematically identical to warrants. Overpriced calls can be sold short (written) and hedged with a long stock position.
Puts and calls together: combining put and call options creates additional hedging structures with different risk-reward profiles.
The total market value of convertible securities has historically represented 10-15% of all listed securities. This creates a large and liquid opportunity set for the hedging approach.
Portfolio Management: Exploiting Price Moves Over Time
An active hedger doesn’t simply enter a position and wait passively for expiration. Markets create adjustment opportunities that can significantly improve returns.
When the common rises substantially: the warrant may now be close to fairly priced. Selling some common stock and shorting additional warrants at the higher price captures more profit from the warrants while reducing overall position risk.
When the common falls substantially: the warrant’s time value is eroding faster. The long common position can be reduced and the profits used to short more warrants at lower prices (the avalanche effect in reverse).
When the warrant drops below normal price: this is the signal to close the position. The premium has been captured. There’s no longer a structural reason to expect further warrant underperformance. Close out, take profits, and redeploy into a new overpriced warrant.
The goal of portfolio management is to extract maximum profit from the warrant’s overpricing while continuously adjusting the hedge to maintain protection against adverse price moves in the stock.
Frequently Asked Questions
What is a warrant hedging strategy?
A warrant hedging strategy involves simultaneously selling overpriced warrants short (betting they’ll fall) while buying the underlying common stock long (as protection if the stock rises). The two positions partially cancel each other’s risk, while the residual profit comes from the warrant’s overpricing being squeezed out as expiration approaches. The historical return from this strategy averaged 25-26% annually over 17 years of live and historical data.
What makes warrants overpriced?
Investors chronically overpay for the leverage potential of warrants. Knowing a warrant could theoretically deliver 10× returns if the stock rises dramatically, they bid the price above what a fair mathematical calculation would suggest. As the expiration date approaches and the probability of such a move decreases, the overpricing corrects. This correction is what the hedger profits from.
How much capital do you need to use warrant hedging?
A margin account is required to sell warrants short. Minimum margin account requirements have historically been around $2,000, though this varies by broker and regulation. The system was designed to work with capital starting from a few thousand dollars and scaling up without changing the fundamental approach.
What is the mix in a warrant hedge?
The mix is the ratio of warrants sold short per share of common stock bought long. A 3-to-1 mix means shorting 3 warrants for every 1 share of stock purchased. The mix determines the balance of protection between the upside (stock rising) and downside (stock falling). Higher mixes provide more upside protection but less downside protection. The 3-to-1 mix has historically been the most balanced choice when the stock is between 30% and 120% of the exercise price.
Can the warrant hedge lose money?
Yes. The main loss scenario is a severe stock decline a fall of more than 50% in a short period. This is rare but possible. Additionally, short squeezes (when someone corners the market in the warrants) can force premature covering at unfavorable prices. The hedge significantly reduces risk compared to either position alone, but it does not eliminate it entirely.
What happened to warrants after the 1967 period covered in the original research?
The listed warrant market has evolved significantly. The modern equivalent is the listed options market, which began trading on the Chicago Board Options Exchange in 1973. The same mathematical principles identifying overpriced options, hedging with the underlying stock, and exploiting the time value decay continue to apply. The approach is now known as delta-neutral hedging or options arbitrage in professional circles.
About the Author — Jamaluddin K.A.
Jamaluddin is the founder of The First Time Investor, a US and UK-focused personal finance and investing education site built for people who want to understand markets without a finance degree. He covers stock market basics, options and warrant strategies, valuation principles, and the kind of investing methods that most financial media never explains clearly.
Disclosure: This article is for educational purposes only and does not constitute financial advice. Trading warrants, options, and using margin involves significant risk, including the potential loss of more than your initial investment. Consult a licensed financial advisor before making investment decisions.