

How to trade stocks like a professional is a question most beginners never ask correctly. They ask “what stocks should I buy?” or “what indicator should I use?” The right question is different: who are you trading against, and are you one step ahead of them?
This guide covers the complete framework for professional-level stock trading from the psychology of market opportunity to reading trend lines, setting stops, taking gains, and most importantly, understanding how to profit when everyone else is doing the obvious thing.
The Market Is Not What You Think It Is
Most people believe they’re trading against the stock market. They’re not.
The stock market is not your opponent. The other traders in it are. Every time you buy, someone is selling to you. Every time you sell, someone is buying from you. The question worth asking the one most beginner trader never ask is: who is that person, and do they know something you don’t?
This is the fundamental shift in perspective that separates consistently profitable traders from the majority who lose. The market is a zero-sum game at the micro level. Money doesn’t appear from nowhere. When one trader makes $10,000, another has effectively lost it. Understanding that you are always trading against other human beings with their own strategies, biases, emotions, and blind spots is the foundation of everything that follows.
The Three Levels of Traders
Every trader in the market operates at one of three levels. Where you sit determines whether you consistently profit, break even, or lose.
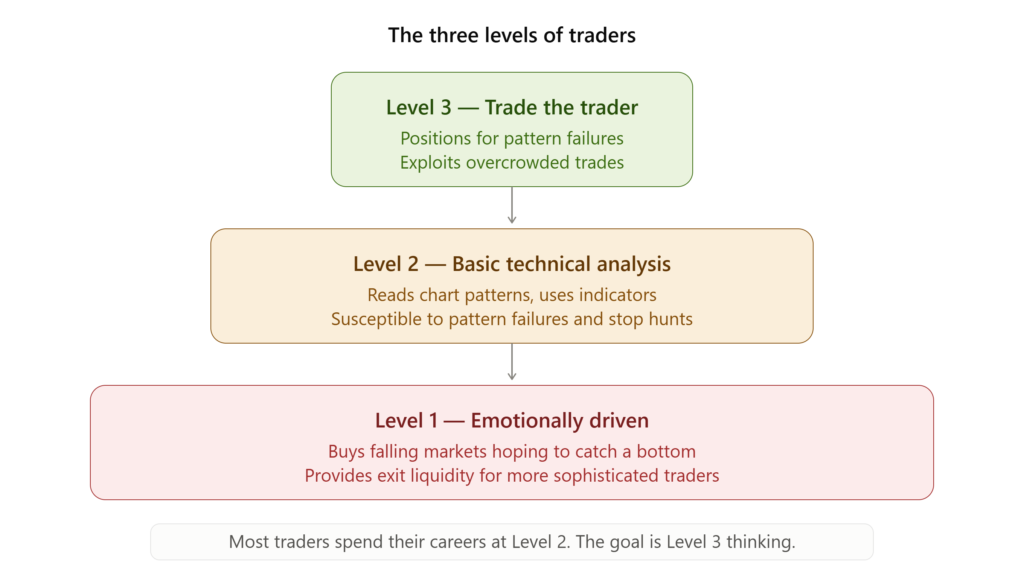
Level One traders buy into falling markets hoping to catch a bottom. They believe they’re being smart and contrarian. They’re typically the ones providing liquidity at the worst possible moments, buying as institutions and more sophisticated traders distribute their inventory into the decline.
Level Two traders have moved beyond Level One. They’ve educated themselves in basic technical analysis support, resistance, breakout patterns, indicators like RSI and MACD. They feel empowered. They recognize setups. But here’s the problem: so does everyone else at their level. When the same chart pattern is obvious to thousands of traders simultaneously, the pattern itself becomes a trap. The 2009 S&P 500 head and shoulders pattern is the textbook example. So widely discussed and acted upon that it failed spectacularly, producing one of the biggest short-covering rallies in market history.
Level Three traders understand all of the above. They know what Level Two traders are seeing, what they’re planning to do, and how to position for the moment when Level Two’s consensus trade fails. This is what it means to trade the trader, not just the market.
Most people will spend their careers at Level Two. The goal of this guide is to help you understand the thinking at Level Three.

It’s All Opportunity: Removing the Good/Bad Mentality
Before strategy, before chart patterns, there’s a psychological hurdle that almost every new trader fails to clear.
Most people view the market as either good (going up) or bad (going down). If it’s a down day, it was a “bad day.” If it’s an up day, it was a “good day.” This framing immediately limits you to profiting from only one-third of available market conditions the one-third when markets are rising.
The market has three states: advancing, declining, and moving sideways. A trader who can only profit from one of them is permanently disadvantaged. A trader who can profit from all three has access to 100% of daily market opportunity instead of 33%.
The shift is conceptual before it’s practical. Before you can profit from falling markets, you have to genuinely believe that a market declining 20% is as rich with opportunity as one rising 20%. You’re not hoping for a direction you’re waiting to recognize and exploit whatever direction arrives.
This removes bias from trading decisions. Bias is the enemy of quantitative systems. When you “feel” a stock should go up because you’ve done research on the company, listened to the CEO, or read positive articles, you’re overlaying subjective opinion on a system that should be purely objective. The market doesn’t care about your research. Price tells you what the market thinks. Your job is to react to price, not argue with it.
Finding Your Edge: The Foundation Before Everything
Here’s the question most traders never honestly answer: if someone asked you to write down your trading strategy in complete detail, could you?

Not vague principles. The exact entry criteria, exit criteria, position sizing rule, stop placement method, and risk per trade.
Most traders can’t do this. They have a general sense of what they look for, a few stocks they’re following, and a loose idea of when they’ll sell. That’s not a strategy. That’s a hope.
Every consistently profitable trader has a defined, testable edge a specific set of rules that produces profitable results over a large enough sample of trades. The key insight about edges is this: you don’t need to be right most of the time. A strategy that wins 55% of the time, with appropriately sized positions and disciplined stops, produces consistent profits because the slight edge compounds over hundreds of trades exactly like the house advantage at a casino.
The casino doesn’t win every hand of blackjack. It wins consistently because the house edge, applied over millions of hands, makes the outcome statistically inevitable. Your goal as a trader is to find your edge and apply it over a large enough sample of trades that statistics work in your favour.
The Three Primary Trading Strategies
Value investing is the buy-and-hold approach associated with Warren Buffett. Identify companies trading below intrinsic value, buy, and wait for the market to recognize what you see. The edge is analytical. The requirement is patience measured in years, not months. The real test: can you watch your investment decline 50-60% during a bear market while staying fully convinced, you’re right? Most people cannot. Those who can, and who have the analytical ability, do very well over 20-30 year periods.
Day trading is zero overnight risk you enter and exit positions within a single trading session, returning to cash each night. The advantage is eliminating overnight risk in an increasingly volatile market. The disadvantage is that it demands near-constant attention to the screen and suits very few personality types. Most people are attracted to day trading by its apparent simplicity, then discover it’s one of the most psychologically demanding activities imaginable.
Technical analysis-based trading specifically pattern recognition on price charts is the approach with the broadest applicability. It can be applied at any time frame (from 5-minute charts to weekly charts), suits both active and semi-passive traders, and has a clear, learnable foundation in human psychology.
The critical insight about choosing a strategy: it must fit your personality and schedule, not just your profit goals. A dentist who can check the market twice daily will fail trading 5-minute charts. A strategy based on weekly setups and daily check-ins is ideal for that same person. This seems obvious. Most traders ignore it.
Pattern Recognition: The Core Skill
Charts are a graphical representation of trader emotions. Each significant price point on a chart corresponds to an emotional experience shared by every investor who was holding the stock at that price.
When a stock drops sharply from $40 to $30, investors who bought near $40 are sitting on losses. If the stock recovers back toward $40, those investors feel relief. Many will sell at their breakeven price “just to get out.” This creates selling pressure at $40. That’s resistance. It’s not a mysterious market force. It’s humans behaving predictably.
When a stock bounces off $25 three times, that’s not coincidence. Each bounce represents buyers who stepped in at $25, made money, and would do it again. When the stock approaches $25 a fourth time, those same buyers plus new buyers who’ve seen the pattern repeat will enter. That’s support. That’s the floor the market has confirmed exists.
Every chart pattern cup and handle, head and shoulders, double bottom, bullish wedge, bearish flag contains within it either a lateral trend or an angular trend. These are the two foundational building blocks.
Lateral Trends
A lateral trend connects two or more significant high points (resistance) or low points (support) at approximately the same price level. When the stock approaches that level from below, it tends to stall. When it approaches from above, it tends to bounce.
Lateral trends gain significance with time and with the number of inflection points. A level tested twice is significant. A level tested four times, with multiple months between tests, is extremely significant. The more traders who’ve bought and sold at that level, the stronger the emotional anchor.
Angular Trends
Angular trends connect price points that ascend (a series of higher lows, creating an ascending trend line) or descend (a series of lower highs, creating a descending trend line).
An ascending angular trend on a stock means buyers keep stepping in at progressively higher prices each dip is bought more aggressively than the last. This is genuine demand. As long as the stock respects the ascending trend, the trade is working. When the stock breaks below the ascending trend, the picture has changed: buyers who were supporting the stock at higher and higher prices have stopped supporting it. That’s your exit signal.
A descending angular trend means sellers keep pushing back any attempt to rally. Lower highs are made with each attempted recovery. This trend should be watched from the short side: when the stock breaks above a well-established descending trend, the sellers have been exhausted, and a significant upside move often follows.
Time Frames Are Fractal
One of the most powerful properties of pattern recognition is its fractal nature the exact same patterns work on a 10-minute chart as on a monthly chart. The underlying reason is the same in both cases: human emotion creates inflection points at significant price levels regardless of the time scale.
This means a trader who can check the market only once a week can still apply the same pattern recognition methodology as a day trader. They simply use weekly charts. The patterns take longer to resolve, but the mechanics are identical.
Selecting the right time frame for your schedule is non-negotiable. A mismatch between your available time and your trading time frame is one of the most common and correctable reasons for consistent losses.
Timing the Entry: Don’t Just Buy Because You Like the Stock
Fundamental analysis tells you what to buy. Timing tells you when. Both matter, but timing is often what separates a 23% profit from a 10% loss on the same stock.
Consider two investors who’ve done identical research on a company and arrive at the same conclusion: the stock is undervalued at $30. Investor 1 buys immediately. Investor 2 waits for a technical confirmation that the stock has stopped falling specifically, a period of sideways price action followed by a breakout above a lateral resistance level.
Over the next few months, the stock falls to $18 before bottoming and recovering. Investor 1 is sitting on a 40% loss and shaken confidence. Investor 2 entered at $22 when the breakout occurred and is sitting on a 23% gain.
Same research. Same stock. Same fundamental thesis. The entry timing created an 83 percentage point gap in outcomes.
Technical entry timing adds value regardless of whether you’re a fundamentals-based investor or a pure technician. Knowing when the market is confirming your thesis through price action reduces the time you spend waiting for the trade to work and increases the probability that it does.
Setting Stops: The Most Important Mechanical Skill
Entering a trade correctly is meaningless without a precise plan for exiting when you’re wrong.
A stop-loss is a pre-defined price at which you will exit a position if it moves against you. It’s not a suggestion. It’s a rule. Set before the trade is entered. Executed without hesitation when hit.
Most traders either don’t use stops or move them when prices approach them. This is how small losses become large losses, and large losses become account-destroying losses.
Why stops must be decided before entry, not after:
The moment a position is moving against you, you’re no longer thinking clearly. Fear activates a survival response. The brain presents rational-sounding reasons to hold: “It’ll come back,” “The news is just temporary,” “I can’t sell here, I’m already down 15%.” These are rationalizations, not analysis. The stop placed before the trade eliminates the moment of decision when your judgment is most compromised.
Where to place the stop:
The stop belongs at a price level that invalidates your trade thesis. If you bought because a stock broke above a key resistance level, your stop belongs just below that level — if the stock falls back below where it broke out, the breakout has failed. Your reason for being in the trade no longer exists.
Place stops at the technical invalidation point, not at a psychological round number or a fixed percentage loss.
Table: Stop Placement by Trade Type
| Trade Type | Entry Trigger | Stop Placement |
|---|---|---|
| Lateral trend breakout (long) | Stock closes above resistance | Just below broken resistance level |
| Angular trend bounce (long) | Stock bounces off ascending trend | Just below the trend line |
| Descending trend break (short) | Stock closes below support | Just above broken support level |
| Angular trend break (short) | Stock drops below ascending trend | Just above the trend line |
Taking Gains: The Other Half of the Equation
Most trading content focuses on entries and stops. Taking profits is treated as almost an afterthought. It shouldn’t be.
The single most costly profit-taking mistake is letting winners turn into losers. A stock up 20% can quickly reverse. Without a plan for taking profits, many traders give back most or all of their gains waiting for “just a little more.”
The primary profit-taking rules:
Never let a gain turn into a loss. Once a position has moved significantly in your favour, raise your stop to at least your break-even price. You’ve earned the right to let the trade play out, but you should never give back so much that a winning trade becomes a loser.
Take partial profits at meaningful levels. When a stock reaches the first significant resistance level above your entry, sell a portion of the position. This locks in real profit, reduces your risk exposure, and relieves psychological pressure on the remaining position.
Let the remaining position run. After taking partial profits and raising your stop, the remaining position is “house money” — you’ve already booked enough profit that the trade is a success regardless of what happens next. This emotional freedom often allows you to hold the remaining position through normal pullbacks, collecting additional profit if the move continues.
Developing Your Complete Trading Plan
A trading plan answers these questions before any trade is placed:
- What is my selection criteria? Which specific pattern or setup do I enter?
- What is my entry method? Anticipatory (enter before the break) or reactionary (enter after confirmation)?
- Where does my stop go? Exactly.
- How much risk per trade? Never risk more than 1-2% of your account on a single trade.
- Where will I take first profits? Identify the first resistance level above your entry.
- When will I move my stop? Define the price level that triggers raising your stop.
- When will I exit the remaining position? What specific event or price action ends the trade?
The plan is written out. Not remembered. Written, then followed. The quality of your plan matters less than the consistency with which you follow it.
Table: Sample Trading Plan Template
| Element | Your Rule |
|---|---|
| Setup | Lateral trend breakout on daily chart |
| Entry method | Reactionary — buy close above resistance |
| Stop placement | 2% below the broken resistance level |
| Risk per trade | 1.5% of account |
| First profit target | First resistance above entry |
| Stop adjustment trigger | When position shows 5% gain |
| Full exit | Violation of ascending trend line |
The Psychology of Consistent Trading
Every mechanical skill in this guide is secondary to one thing: emotional management. The market will find your weaknesses. Every unresolved emotional pattern you bring to trading overconfidence, fear of loss, revenge trading, attachment to opinions will cost you money with reliable consistency.
The most common emotional pitfalls:
Overconfidence after wins. A string of profitable trades produces a dangerous feeling of certainty. The market will humble you. Trade sizing should be based on your tested edge, not on recent results.
Revenge trading. Taking a large loss and immediately entering new trades to “make it back” leads to compound losses. After any significant loss, step away. The market will be there tomorrow.
Attachment to opinions. The most expensive belief in trading is “I was right, the market is wrong.” You rode Winn-Dixie all the way to bankruptcy listening to fundamentals. The stock told a different story for months before the end. Price is truth. Everything else is theory.
Correlation between mood and market direction. If you feel good when markets go up and bad when they go down, you’re emotionally correlated with the market. Profitable trading requires the ability to be entirely neutral about direction — seeking only to identify and execute on whatever opportunity the price action presents.
The Blowup: What Destroys Most Trading Accounts
Catastrophic, account-devastating losses are almost never the result of one bad trade. They’re the result of one bad trade that wasn’t stopped, which grew into a larger loss, which triggered emotional responses (denial, hope, revenge), which led to additional undisciplined trades, which compounded the damage.

The blowup almost always follows this sequence:
- A trade goes against the plan but isn’t exited
- The loss grows beyond what the position sizing formula would have allowed
- The trader doubles down to “average” the position
- The loss grows to an emotionally unacceptable level
- Desperation leads to oversized positions trying to recover quickly
- Another large loss follows
Every element of the system described in this guide the defined strategy, the pre-set stop, the position sizing rule, the profit-taking plan exists to prevent this sequence from starting. Remove any one element, and the door is open.
The most important rule in trading is not a pattern or an entry signal. It’s this: cut losses quickly, let profits run. It’s universally known. It’s almost universally violated. Build it into your mechanical system so that following it requires no willpower in the moment.
Frequently Asked Questions
What does it mean to “trade the trader”?
Trading the trader means positioning to profit when widely observed chart patterns fail because too many traders are positioned the same way. When a technical setup becomes so obvious that it’s discussed across mainstream media and trading communities simultaneously, the crowd’s one-sided positioning creates the conditions for a violent reversal. Level Three traders identify these overcrowded setups and position for the failure, rather than following the crowd into it.
What is the most important rule in stock trading?
Cut losses quickly and let profits run. Every consistently profitable trader follows some version of this rule. The pre-set stop-loss placed before the trade is entered, at the price that invalidates your trade thesis is the mechanical implementation of this principle. Without it, small losses grow into large ones, and no strategy survives large losses indefinitely.
How do I find my trading edge?
Start with a defined strategy a specific set of rules that determines which setups you take, when you enter, where your stop goes, and when you take profits. Apply this strategy consistently across a large enough sample of trades (at minimum 20-30) to evaluate its performance. If the results are positive, refine and continue. If not, identify the specific failure mode and adjust one variable at a time. An edge is discovered through testing, not through searching for the perfect system.
What time frame should I trade?
The time frame that fits your actual schedule, not the one you wish you had. A trader who can check the market only once daily should trade daily or weekly charts, not 5-minute or 30-minute charts. Pattern recognition works identically across all time frames because the emotional dynamics creating the patterns are the same at every scale. Matching your time frame to your schedule is one of the most high-impact, lowest-effort improvements most traders can make.
How much of my account should I risk per trade?
No more than 1-2% of total account value per trade. At 1% risk per trade, you can have 50 consecutive losing trades and still have half your account. This ensures that no single trade, or even a losing streak, is catastrophic. Most retail traders risk far too much per trade 10%, 20%, or more which means a normal drawdown becomes an account-ending event rather than a manageable setback.
Why do most technical analysis patterns fail for most traders?
Because basic technical patterns are now known and applied by so many traders that the patterns themselves have changed character. When enough traders position identically based on the same widely known pattern, the trade becomes overcrowded. Institutions and more sophisticated traders use these predictable positioning moments to execute at better prices triggering stop-outs before the expected move occurs, then reversing. Basic technical analysis remains valid, but it must be combined with awareness of what other traders are doing and when the consensus trade is likely to fail.
About the Author — Jamaluddin K.A.
Jamaluddin is the founder of The First Time Investor, a US and UK-focused personal finance and investing education site. He covers stock market fundamentals, trading strategies, and investing principles for people who want to build genuine market knowledge without a finance degree.
Disclosure: This article is for educational purposes only and does not constitute financial advice. Trading stocks involves significant risk, including the potential loss of principal. Past strategy performance does not guarantee future results. Consult a licensed financial advisor before making investment decisions.