
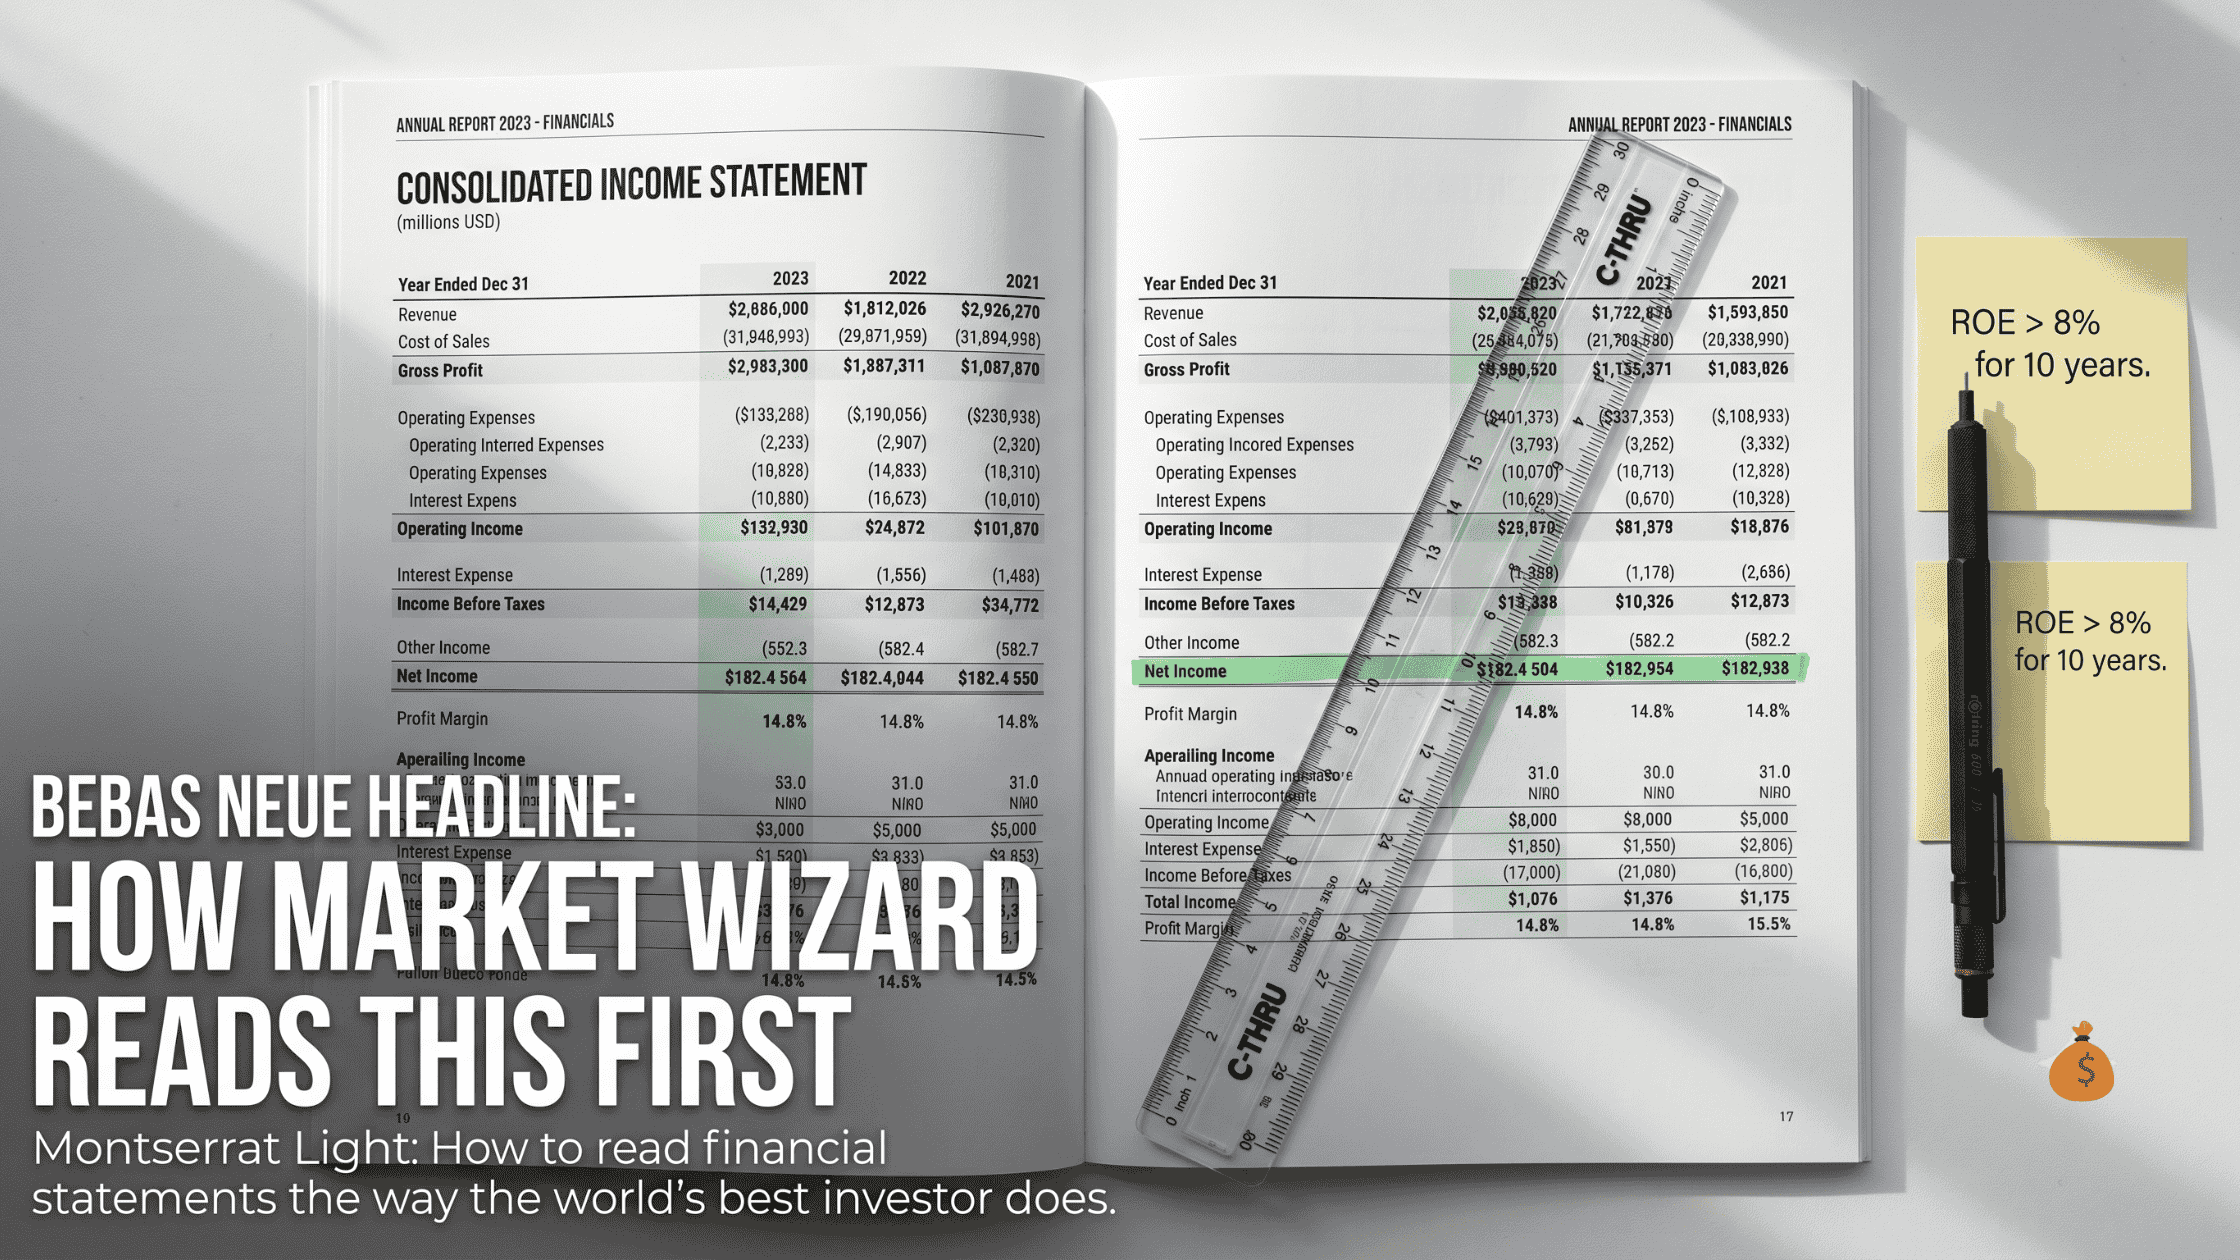
How to read financial statements for value investing is the skill that separates investors who guess from investors who know. Most people buy stocks based on news, tips, or price momentum. Warren Buffett buys businesses. And to buy a business intelligently, you have to understand what its financial statements are actually telling you.
This guide covers the complete framework from how to think about the stock market, through the four principles of value investing, to reading each line of the income statement, balance sheet, and cash flow statement with fresh eyes. No accounting degree required.
How to read financial statements for value investing Before Reading Any Statement
Before opening a single financial statement, the most important shift is conceptual.
Most people see stocks. Value investors see companies. That difference changes everything.
When you own one share of a business, you own a proportional piece of every asset, every dollar of revenue, and every dollar of profit that business generates. One share is not a lottery ticket or a price on a screen. It’s fractional ownership of a real operation with real employees, real products, and real cash flows.
Benjamin Graham described the stock market through his famous Mr. Market allegory. Mr. Market is an emotional business partner who shows up every day with an offer to buy your shares or sell you more. Sometimes he’s euphoric and quotes absurdly high prices. Sometimes he’s depressed and quotes irrationally low ones. The key insight: you never have to accept his offer. You can ignore him completely until he quotes a price that makes sense.
In the short run, the market is a voting machine driven by sentiment, fear, and greed. In the long run, it is a weighing machine driven by actual business performance. Value investors wait for the voting machine to misprice what the weighing machine will eventually confirm.
When markets drop, most people panic. Value investors get excited. A falling market means you can buy the same business at a cheaper price. The only exception: if you’ll need the money within 1-2 years. If time is on your side, declining markets are a gift.
The Three Financial Statements: What Each One Tells You
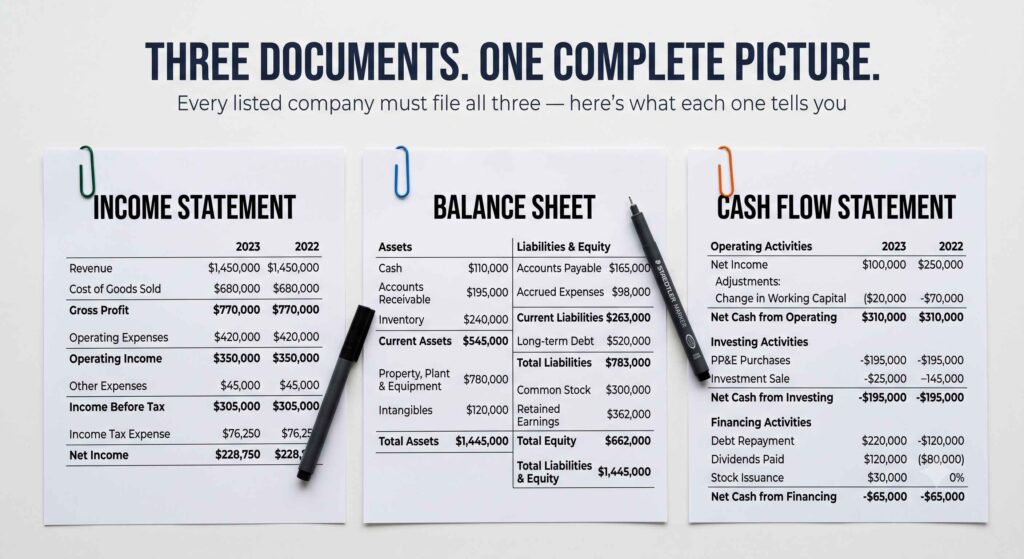
Every publicly traded company files three core financial statements. Together they answer three questions:
The income statement: How much profit did the company make this year?
The balance sheet: What is the company worth right now?
The cash flow statement: How is cash actually moving through the business?
They’re filed annually as a 10-K (within 60-90 days of fiscal year end), quarterly as a 10-Q (within 40-45 days of quarter end), and immediately for material events as an 8-K. All three are publicly available through the SEC’s EDGAR database.
The Income Statement: From Revenue to Net Income
The income statement tracks one period of business activity typically one year. It answers: how much did the company earn, how much did it spend, and what was left over?
Table 1: Sample Income Statement
| Line | Item | Amount (millions) |
|---|---|---|
| 1 | Revenue | $13,279 |
| 2 | Cost of Revenue | -$5,348 |
| 3 | Gross Margin (1-2) | $7,931 |
| 4 | Sales and Marketing | -$1,105 |
| 5 | Research and Development | -$863 |
| 6 | General and Administration | -$538 |
| 7 | Other Operating Expenses | -$1,350 |
| 8 | Total Operating Expenses (4+5+6+7) | -$3,856 |
| 9 | Income from Operations (3-8) | $4,075 |
| 10 | Net Interest Income/(Expenses) | -$135 |
| 11 | Extraordinary Income/(Expenses) | +$275 |
| 12 | Income Taxes | -$1,352 |
| 13 | Net Income | $2,863 |
The top line is revenue total money earned from selling products or services. The bottom line is net income what remains after every cost, tax, and expense. Everything in between is the story of how efficiently the business converts its top line into profit.
Earnings Per Share (EPS) divides net income by shares outstanding. At $2,863M net income with 100M shares outstanding, EPS = $28.63. This is one of the most watched numbers in investing because it measures the profit attributable to each share you own.
Gross Margin: The First Filter
Gross margin is revenue minus cost of revenue, divided by revenue.
A gross margin of 59.7% ($7,931 / $13,279) means the company keeps nearly 60 cents of every revenue dollar before paying operating expenses. High gross margins are often a sign of pricing power the company charges more than it cost to deliver the product. Companies like Coca-Cola, Microsoft, and Apple consistently show gross margins above 40-60%. Manufacturing-heavy businesses often show 20-30%.
The Profit Margin
Net profit margin divides net income by revenue.
$2,863 / $13,279 = 21.6%
This tells you how many cents of profit flow through from every dollar of sales after every cost, tax, and expense. Buffett looks for companies with consistently high and stable profit margins over 10+ years a sign of durable competitive advantage.
The Balance Sheet: What Does the Company Actually Own?
The balance sheet is a snapshot of what the company owns (assets), what it owes (liabilities), and what’s left for shareholders (equity) at a specific date.
The equation is always: Assets = Liabilities + Equity
Think of it in personal terms. You own a house worth $300,000 (asset). You have a $200,000 mortgage (liability). Your equity is $100,000.
Table 2: Simplified Balance Sheet
| Assets | Amount | Liabilities + Equity | Amount |
|---|---|---|---|
| Cash and cash equivalents | $4,200 | Accounts payable | $2,100 |
| Accounts receivable | $3,100 | Short-term debt | $1,500 |
| Inventory | $2,800 | Long-term debt | $8,200 |
| Property and equipment | $9,400 | Other liabilities | $2,800 |
| Intangible assets | $3,100 | Total Liabilities | $14,600 |
| Other assets | $1,400 | Shareholders’ equity | $9,400 |
| Total Assets | $24,000 | Total Liabilities + Equity | $24,000 |
Book value per share is shareholders’ equity divided by shares outstanding. At $9,400M equity / 100M shares = $94 book value per share. This represents the theoretical liquidation value of the company what shareholders would receive if all assets were sold and all debts paid.
Warren Buffett has noted that changes in book value per share closely track changes in intrinsic value over time. Consistent book value growth is one of his clearest signals of a high-quality business.
Warren Buffett’s Four Principles of Value Investing
With the financial statement framework in place, Buffett applies four clear principles before making any investment.
Principle 1: Vigilant Leaders
Management is your agent. Their one job is to maximize the value of your invested capital. Four rules help you evaluate them:
Rule 1: Low debt (D/E ratio below 0.5)
The debt-to-equity ratio divides total liabilities by shareholders’ equity.
D/E = Total Liabilities / Shareholders’ Equity
At the balance sheet above: $14,600 / $9,400 = 1.55. This would fail Buffett’s test.
Buffett prefers D/E below 0.5. Think of debt like the accelerator in a car. On a smooth road, it gets you places faster. On sharp curves recessions, credit crunches, competitive disruptions it makes the vehicle impossible to control. A highly indebted company has very little room to maneuver when conditions change.
Table 3: D/E Ratio and What It Means
| D/E Ratio | What It Signals | Buffett’s View |
|---|---|---|
| Below 0.5 | Conservative financing, high flexibility | Preferred |
| 0.5 to 1.0 | Moderate debt, manageable | Acceptable in some industries |
| 1.0 to 2.0 | Elevated debt, limited agility | Caution required |
| Above 2.0 | High leverage, significant risk | Generally avoid |
Rule 2: Current ratio above 1.5
Current ratio = Current Assets / Current Liabilities
This measures whether the company can meet its short-term obligations with its short-term assets. A ratio of 1.5 means the company receives $1.50 for every $1.00 it must pay within 12 months. Buffett prefers this ratio between 1.5 and 2.5. Below 1.0 means the company may need to borrow money just to pay its current bills.
Rule 3: Consistent ROE above 8% over 10 years
Return on Equity = Net Income / Shareholders’ Equity
ROE is arguably Warren Buffett’s single most important ratio. It measures how efficiently management converts shareholders’ money into profit.
The money machine illustration: a machine costs $100,000 and generates $10,000 annually. ROE = 10%. Now add a second machine costing $200,000 but also generating $10,000. Combined ROE falls to 6.7%. The company is now deploying more of your capital to produce the same dollars of profit — exactly the wrong direction.
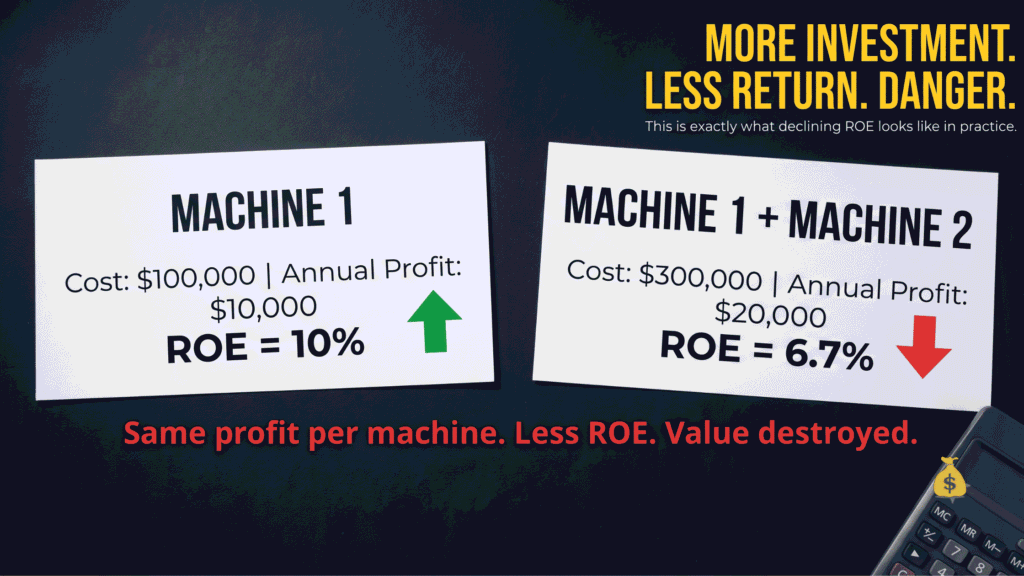
Buffett wants ROE consistently above 8% for at least 10 years. A declining ROE trend signals management is retaining earnings but generating lower returns on the reinvested capital a critical warning sign.
Table 4: ROE Assessment Framework
| ROE (10-year average) | Trend | Assessment |
|---|---|---|
| Above 15% | Rising or stable | Excellent — strong competitive advantage likely |
| 10-15% | Stable | Good — competent capital allocation |
| 8-10% | Stable | Adequate — meets Buffett’s minimum |
| Below 8% | Any direction | Avoid — below cost of capital |
| Any level | Declining | Warning — management eroding shareholder value |
Rule 4: Appropriate management incentives
Management compensation tied to short-term stock price gives leaders the wrong incentives. It rewards actions that boost earnings artificially in the short term (and depress them later), encourages share buybacks over dividends, and promotes empire-building acquisitions.
Look in the annual report’s notes for compensation structure. Companies with trustworthy management disclose how base pay and variable pay are tied to long-term performance metrics aligned with shareholder interests.
Principle 2: Long-Term Prospects
Two rules apply here.
Rule 1: Persistent products
Buffett’s test: “Will the Internet change the way we use the product?”
Coca-Cola has been consumed for over 130 years. The Internet has never changed how people drink Coke. Compare that to smartphones, newspapers, or physical retail all of which technology has dramatically disrupted within a decade.
A persistent product is one that has been here for 30+ years and will plausibly still be here in another 30. This isn’t about avoiding technology companies entirely. It’s about recognizing that products dependent on technological continuity carry fundamentally different risk than products tied to basic human behavior.
Rule 2: Minimize taxes through long holding periods
Every sale triggers a taxable event. Short-term capital gains (holding less than 1 year) are taxed at ordinary income rates up to 37% at the highest bracket. Long-term capital gains (holding more than 1 year) are taxed at 0%, 15%, or 20% depending on income.
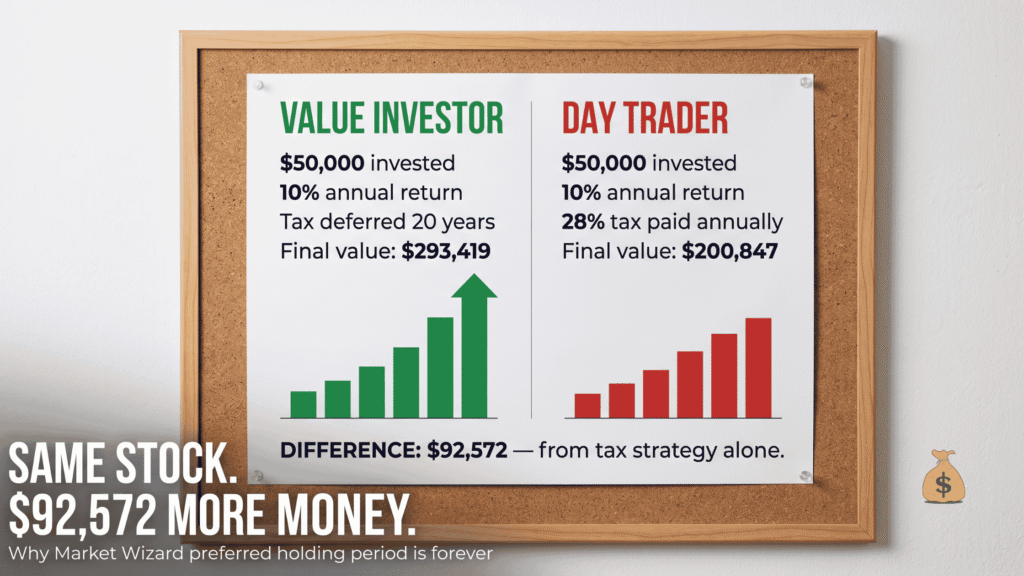
Table 5: Value Investor vs Day Trader — $50,000 Over 20 Years at 10% Annual Return
| Value Investor | Day Trader (28% bracket) | |
|---|---|---|
| Starting investment | $50,000 | $50,000 |
| Annual return | 10% | 10% |
| Tax paid annually | $0 (deferred) | ~28% on gains each year |
| Value at Year 20 (before tax) | $336,375 | ~$240,000 |
| Tax paid at liquidation | $43,000 (15% on gain) | $59,000+ (annual taxes over 20 years) |
| Final after-tax value | $293,419 | $200,847 |
Same stock. Same 10% return. $92,572 more for the value investor purely from tax efficiency. Warren Buffett’s preferred holding period is forever, and this table explains exactly why.
Principle 3: Stable and Understandable
Rule 1: Stable book value growth from owner’s earnings
Book value per share should grow consistently year over year. Consistent growth means the company is earning money, retaining it wisely, and compounding it at rates that increase equity over time.
A simple test: plot EPS and book value per share for the last 10 years. If they rise steadily with minimal interruption, you’re looking at a stable business. If they spike, crash, and swing unpredictably, the business is not stable regardless of the latest earnings report.
Rule 2: Sustainable competitive advantage (the moat)
Buffett uses the castle-and-moat analogy. Competitors are enemies who want to capture your castle (market share and profits). A moat is whatever keeps them out.
Three primary types of economic moats:
Intangible assets (brands and patents): A mother picking a movie for her kids chooses the Disney movie at $1 premium without knowing if it’s better. The brand is the moat. Patents achieve the same thing legally no competitor can copy the product for the patient’s life.
Cost structure (low-cost producer): Walmart buys at volumes and prices no competitor can match. Passing those savings to customers creates a price moat that’s nearly impossible to breach without matching the scale.
Switching costs (stickiness): Microsoft Windows runs on the overwhelming majority of computers not because it’s superior to every alternative, but because the cost and friction of switching in time, retraining, and compatibility is enormous. A business with high switching costs retains customers through inertia as much as satisfaction.
Table 6: Moat Type and Examples
| Moat Type | Description | Example Companies |
|---|---|---|
| Brand and intangibles | Premium pricing from trust and recognition | Coca-Cola, Disney, Apple |
| Cost structure | Lower costs than any competitor | Walmart, Amazon |
| Switching costs | High friction to change provider | Microsoft, Oracle, Salesforce |
| Network effects | Value increases with each new user | Visa, Mastercard, Meta |
| Regulatory moats | Government licenses or barriers | Utilities, local banks |
Principle 4: Buy at Attractive Prices
The first three principles identify what to buy. The fourth determines when the price is right.
Intrinsic Value and the Margin of Safety
Intrinsic value is what a business is actually worth based on the cash flows it will generate over its life, discounted back to today. Market price is what Mr. Market is currently charging.
The margin of safety is the gap between the two.
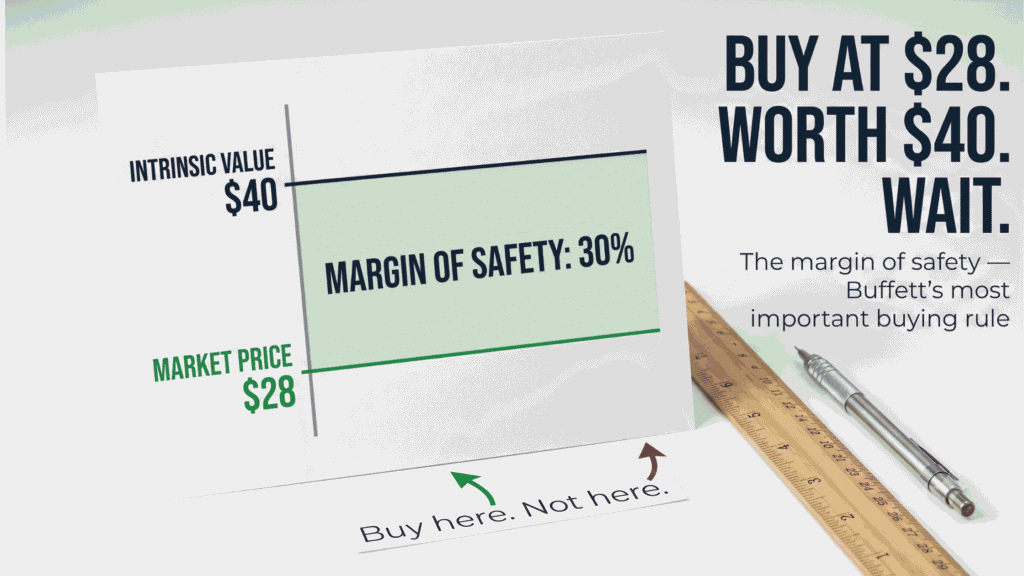
If your intrinsic value calculation suggests a company is worth $40 per share and the current price is $28, your margin of safety is 30%. That gap protects you if your growth assumptions prove optimistic, if competitive advantages erode faster than expected, or if the correction takes longer than anticipated.
Buffett’s approach to intrinsic value begins with the P/E ratio Price divided by EPS inverted to an earnings yield.
At a stock price of $50 and EPS of $5, the P/E is 10 and the earnings yield is 10%. That yield is what the business returns to you as a percentage of what you pay for it. Compare it to the current US Treasury bond rate. If Treasuries pay 5% and this business earns 10% on your invested price with growth prospects the business is likely undervalued.
The 10-Year Growth Model
A simplified valuation approach:
- Find the current EPS
- Estimate the growth rate for the next 10 years (use historical EPS growth conservatively)
- Project EPS in Year 10
- Multiply by a reasonable P/E (10-15 for conservative valuation, 15-20 for higher confidence)
- Discount back to today at your required rate of return
- Compare the resulting intrinsic value to the current stock price
If the stock trades at a 30% or more discount to intrinsic value, you have a meaningful margin of safety.
Table 7: Simple Intrinsic Value Calculation Example
| Input | Value |
|---|---|
| Current EPS | $3.00 |
| Historical EPS growth (10-year average) | 8% per year |
| Projected EPS in Year 10 | $6.47 |
| Applied P/E at Year 10 | 15x |
| Projected stock price in Year 10 | $97 |
| Discounted to today at 10% required return | $37.40 |
| Current market price | $28.00 |
| Margin of safety | 25% |
The Cash Flow Statement: Where Truth Lives
The income statement can be managed. Revenues can be recognized early. Expenses can be deferred. Creative accounting can make a mediocre business look strong.
The cash flow statement is harder to manipulate. Cash either arrived or it didn’t.
Table 8: Three Sections of the Cash Flow Statement
| Section | What It Shows | Red Flags |
|---|---|---|
| Cash from Operations | Cash generated by the core business | Consistently negative OCF with positive net income |
| Cash from Investing | Cash spent on or received from investments | Heavy capex with no growth to show for it |
| Cash from Financing | Cash from issuing stock/debt or paying dividends | Constant equity dilution or unsustainable dividends |
Operating Cash Flow vs Net Income: They should trend together over time. If net income is consistently much higher than operating cash flow, the company may be reporting revenue it hasn’t actually collected. If operating cash flow consistently exceeds net income, the business is generating more real cash than accounting profit suggests often a positive sign.
Free Cash Flow = Operating Cash Flow – Capital Expenditures
Free cash flow is the purest measure of what the business actually generates for its owners after maintaining and investing in its operations. Buffett calls the equivalent calculation “owner earnings” — the cash available to the owner to use however they choose. It’s the number that drives intrinsic value more than any other.
The Key Ratios at a Glance
Table 9: Warren Buffett’s Core Screening Ratios
| Ratio | Formula | Buffett’s Target | What It Measures |
|---|---|---|---|
| Debt-to-Equity | Total Debt / Equity | Below 0.5 | Financial risk and flexibility |
| Current Ratio | Current Assets / Current Liabilities | Above 1.5 | Short-term liquidity |
| Return on Equity | Net Income / Equity | Above 8%, consistent | Management efficiency |
| Gross Margin | Gross Profit / Revenue | Above 40% preferred | Pricing power |
| Net Profit Margin | Net Income / Revenue | Stable and growing | Overall profitability |
| P/E Ratio | Price / EPS | Low relative to growth | Whether price is attractive |
| EPS Growth | Year-over-year EPS trend | Consistent 8-12%+ | Earnings trajectory |
| Book Value Growth | Year-over-year BV per share | Consistent and positive | Business wealth accumulation |
No single ratio tells the complete story. Each one is a window into a different aspect of the business. Used together, over a 10-year trend rather than a single year’s snapshot, they build a reliable picture of whether the business is worth owning and at what price.
Frequently Asked Questions
What financial statements does Warren Buffett read?
Buffett reads all three: the income statement (to evaluate profitability and margins), the balance sheet (to assess financial strength, book value, and debt levels), and the cash flow statement (to confirm that reported earnings translate into real cash). He focuses on 10-year trends rather than any single year, and specifically looks at EPS, book value per share, ROE, D/E ratio, and free cash flow.
What is the most important financial ratio for value investing?
Return on Equity (ROE) is arguably the most important single ratio. It measures how effectively management converts shareholders’ money into profit. Warren Buffett looks for companies with consistent ROE above 8% over at least 10 years — not a high ROE in one exceptional year, but sustained, reliable efficiency across market cycles.
What is a margin of safety in value investing?
The margin of safety is the discount between a stock’s intrinsic value (what it’s actually worth) and its current market price (what Mr. Market is charging). Buying at a significant discount to intrinsic value protects you when your growth assumptions prove too optimistic or when the market takes longer than expected to recognize the company’s value. Most value investors look for a 25-35% margin of safety minimum.
How do you calculate intrinsic value for a stock?
The basic approach: estimate EPS 10 years from now using a conservative historical growth rate. Multiply by a reasonable P/E. Discount that future price back to today at your required rate of return (typically 10-15%). Compare the result to the current stock price. If the stock trades well below your calculated value, you have a margin of safety.
What is an economic moat and why does it matter?
An economic moat is a sustainable competitive advantage that prevents competitors from eroding a company’s profits over time. Without a moat, any successful business will eventually be imitated, undercut, or disrupted. Buffett’s three primary moat types are intangible assets (brands and patents), cost structure advantages (lowest-cost producer), and switching costs (high friction to change providers).
Where can I find a company’s financial statements?
All US-listed companies file their annual 10-K and quarterly 10-Q reports with the SEC. These are publicly available at sec.gov/edgar. You can also find them on the investor relations section of any company’s website. Financial data aggregators like Macrotrends, Morningstar, and Simply Wall St provide the same data in pre-formatted charts, making it easier to view 10-year trends without building your own spreadsheet.
About the Author — Jamaluddin K.A.
Jamaluddin is the founder of The First Time Investor, a US and UK-focused personal finance and investing education site built for people who want to understand markets without a finance degree. He covers fundamental analysis, value investing principles, financial statement interpretation, and stock market basics.
Disclosure: This article is for educational purposes only and does not constitute financial advice. All investing involves risk including the potential loss of principal. Consult a licensed financial advisor before making investment decisions.