

How to analyze stock fundamentals using financial statement trends is one of the most searched and most poorly answered questions in beginner investing. Most guides hand you a list of ratios, tell you what’s “good” or “bad,” and call it done.
That’s not analysis. That’s a snapshot of a single moment in a company’s financial life. And a single moment tells you almost nothing.
Here’s what actually works: tracking how those numbers move over time. A company’s current ratio of 2-to-1 sounds healthy. But if it was 3-to-1 two years ago and 2.5-to-1 last year, that’s a company slowly losing financial footing even though today’s number still looks fine on paper.
This guide breaks down the trend-based approach to fundamental analysis, why it works, and exactly how to apply it as an everyday investor.
Why a Single Year of Financial Data Can Fool You
Financial statements come out once a year or quarterly for public companies. Most investors read the latest report, compare a few numbers to industry benchmarks, and make a call.
The first problem with that approach is timing. By the time you see a company’s annual report, the financial data inside it is already 3 to 6 months old. Quarterly reports get filed weeks after the period ends. What you’re reading is a photograph of a business that has already moved on.
The second problem is more subtle. Financial statements aren’t precise scientific measurements. They’re legal interpretations of what happened. Accounting rules give companies real discretion in how they report things how they estimate bad debt reserves, when they recognize revenue, how they handle write-offs. Two companies in the same industry, equally profitable, can produce quite different-looking statements based entirely on which accounting methods they choose.
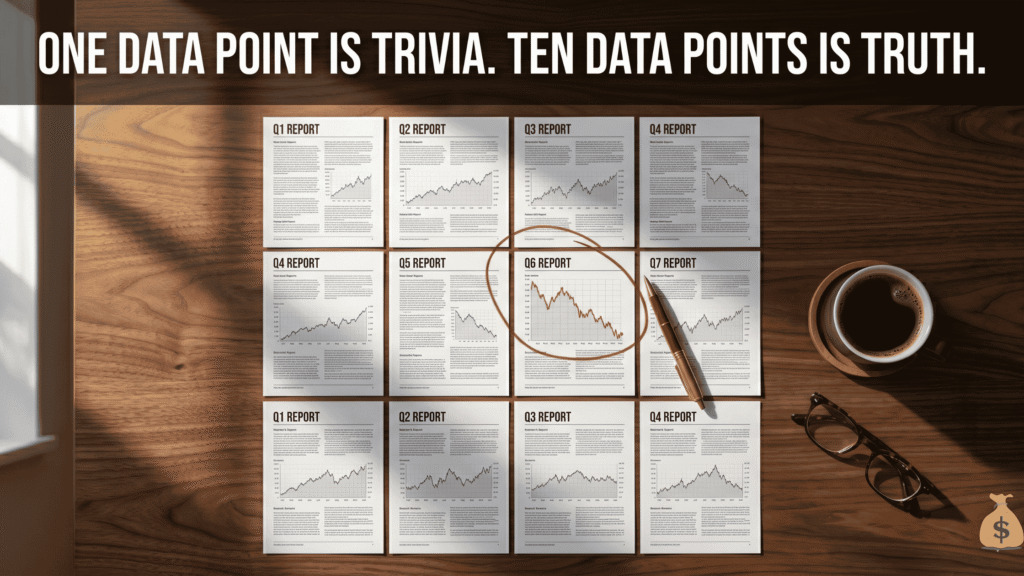
The key insight: one year of data gives you a number. Multiple years of data give you a direction. And direction is what matters.
A company growing steadily is worth more attention than a company posting one great year after two bad ones.

What Fundamental Analysis Actually Measures
Fundamental Analysis is the practice of evaluating a company based on its actual financial performance earnings, revenue, debt levels, cash flow, and growth rather than short-term price movements.
The goal is simple: figure out whether a company is genuinely healthy, growing, and capable of sustaining that growth. Then decide whether the current stock price reflects that reality.
Here’s what the core financial statements tell you:
The balance sheet is a snapshot of everything the company owns (assets) versus everything it owes (liabilities). The difference between the two is shareholders’ equity the theoretical value belonging to stockholders. It’s organized into current assets and liabilities (due within 12 months) and long-term assets and liabilities (beyond 12 months).
The income statement shows revenue, costs, and profit over a specific period. This is where you see whether the company is actually making money, and how much of its revenue converts to profit.
The cash flow statement tracks actual cash moving in and out. A company can report profits on paper while running dangerously low on real cash. The cash flow statement catches that gap.
None of these documents are complete on their own. Together, over multiple periods, they build a picture of where a company has been and where it’s likely heading.
The Reliability Problem No One Talks About
Here’s something most investing guides skip entirely: the numbers in financial statements are not always what they appear to be.
That’s not an accusation of fraud. It’s a description of how accounting works.
Take earnings. Under generally accepted accounting principles (GAAP), companies have considerable discretion in how they estimate reserves for uncollectable debts, how they time the recognition of certain revenues, and how they handle depreciation. A company can legally defer reporting a loss until a future year. It can also hold back some of a very good year’s profits in reserve then release them during a weaker year to smooth out the results.
This practice of smoothing earnings over time is called “banking earnings.” It makes a company look more consistent than it actually is. From the outside, the numbers look stable. From the inside, management is timing what gets reported and when.
This doesn’t mean financial statements are useless. It means you need to read them with appropriate skepticism. The way to do that is to look at trends because artificial smoothing can only work for so long. Over 5 to 8 years of data, the real trajectory of a business becomes visible even through the accounting fog.

How to Analyze Stock Fundamentals Using the Right Ratios Over Time
Ratios convert raw financial statement numbers into comparable metrics. The same ratio calculated across 10 to 12 consecutive quarters gives you a trend line far more useful than any single reading.
How to Analyze Stock Fundamentals Using the Right Ratios Over Time
The current ratio is current assets divided by current liabilities. It measures a company’s ability to meet short-term obligations using short-term resources.
A reading of 2-to-1 is generally considered healthy the company has twice the assets needed to cover near-term debts. But here’s what most guides don’t tell you: the current ratio can look fine even when a company is quietly building up problems.
Overly high cash balances, slow-moving inventory, and uncollected receivables all count as current assets. They inflate the current ratio without reflecting actual financial strength. When you track the ratio quarterly over 3 years, a slow drift downward from 2.8 to 2.3 to 1.9 signals a company whose financial cushion is thinning, even when each individual reading still looks reasonable.
Debt-to-equity ratio
This measures long-term debt against shareholders’ equity. It shows how much of the company’s operations are funded by borrowed money versus actual ownership value.
A rising debt-to-equity ratio over several years tells you the company is leaning more heavily on debt to sustain itself. That’s not always bad debt can fund growth. But the direction matters. A company that increases its debt-to-equity from 0.4 to 1.1 over 5 years is changing its risk profile significantly, regardless of whether the current earnings look strong.
Net profit margin
Revenue divided into net income gives you the percentage of sales that actually becomes profit. Track this quarterly and you’ll spot whether a company’s profitability is expanding, holding steady, or quietly eroding even as its revenues grow.
A company that grows revenue 15% year-over-year but whose profit margin shrinks from 12% to 8% over the same period is working harder for less. That trend is often visible years before it becomes a crisis.
Working capital turnover
This is sales divided by working capital (current assets minus current liabilities). It shows how efficiently the company converts its available capital into revenue.
A declining working capital turnover the company generating less revenue per dollar of working capital over time can signal operational inefficiency building slowly beneath an otherwise clean surface.
Why the Market Overreacts to Earnings — And How to Use That
Here’s one of the most useful things a fundamental investor can understand about how stock prices move.
When a company reports earnings, analysts have already predicted a number. The market reaction isn’t based on whether the company performed well in absolute terms. It’s based on whether the result was above or below the prediction.
Say a company reliably earns around 8% annual return. Analysts predict 10%. The company delivers 9% an excellent real-world result. The stock drops. Because in the market’s eyes, 9% against a 10% prediction reads as a miss.
This is the market reacting to a perception, not a fact. And it creates a real opportunity for investors who do their own fundamental homework.
When a fundamentally strong company takes a short-term price hit because it missed an analyst estimate while its underlying trends in revenue, margins, and debt levels remain solid that’s often the moment to pay closer attention, not to run.
The market almost always overreacts to near-term news. Long-term fundamental investors benefit from staying anchored to the actual numbers while the crowd chases the headlines.
How to Read a Trend: A Practical Framework
You don’t need accounting expertise to track financial trends. Here’s a practical approach:
- Gather 8 to 12 quarters of data. Most company investor relations pages and financial data sites (SEC EDGAR, annual reports, Morningstar) provide this. Four data points is too few to see a real direction. Twelve is enough to spot meaningful movement.
- Pick 3 to 4 ratios. Current ratio, debt-to-equity, net profit margin, and working capital turnover give you a well-rounded view of liquidity, leverage, profitability, and efficiency.
- Look for the direction, not the number. A current ratio of 1.8 is less useful than knowing whether 1.8 represents a stable plateau or the bottom of a 3-year slide from 2.9.
- Watch for inflection points. Two or three consecutive quarters of a ratio moving sharply in one direction often signals something real changing inside the business before that change shows up in the stock price or in analyst coverage.
- Compare within the same industry. A 15% profit margin means very different things in a software company versus a grocery chain. Industry context is the benchmark that makes trend data useful.
- Treat outlier quarters with skepticism. One dramatically strong or weak quarter rarely tells a complete story. It’s usually related to a one-time event — an asset sale, a write-off, a lawsuit settlement. The surrounding quarters tell you what’s real.
The Case for Contrarian Thinking in Fundamental Investing
One of the most consistent findings about long-term investing is that professional fund managers as a group don’t beat the market average. One Consumer Reports survey of 289 mutual funds found that only 22% beat the market average over a measured period. A Morningstar study found similar results: in most years, the majority of professionally managed funds underperform the S&P 500.
That’s not because fund managers lack intelligence or resources. It’s because they operate in an environment that rewards short-term thinking quarterly performance targets, client expectations, peer comparisons. The institutional environment itself pulls against long-term fundamental discipline.
The individual investor has a structural advantage here that most don’t use. You’re under no obligation to react to quarterly performance pressures. You can study the fundamentals of 10 companies carefully, identify the 3 whose multi-year trends look genuinely strong, and hold them through the market noise.

That patience grounded in real fundamental data rather than price movement or analyst predictions is what generates long-term returns. The crowd chases the index and the latest earnings beat. The fundamentalist quietly studies 8 years of working capital trends and acts when price and value diverge.
Common Mistakes When Analyzing Company Financials
Reacting to a single quarter. One strong or weak quarter almost never represents the underlying business. It takes at least 3 to 4 consecutive quarters moving in the same direction before a trend becomes meaningful.
Ignoring the timing gap. By the time you read a financial report, that data is already several months old. The company has already made payroll, signed contracts, lost customers, or won new ones that won’t appear until the next report. Build that lag into your expectations.
Trusting smooth earnings as a sign of stability. A company whose earnings grow at exactly the same pace year after year, quarter after quarter, may be managing those numbers more than it’s reporting them. Real businesses have bumpy results. Perfectly smooth earnings are worth investigating, not celebrating.
Using ratios without industry context. A debt-to-equity ratio of 1.5 is aggressive in retail but fairly normal in capital-intensive industries like utilities or manufacturing. The number alone means nothing. The industry average gives it context.
Following analyst predictions instead of actual data. Analyst forecasts reflect expectations, not fundamentals. The market price reflects expectations. Your job as a fundamental investor is to look at what’s actually in the financial statements and make your own judgment about what that means for the long term.
FAQ: Analyzing Stock Fundamentals Using Financial Statement Trends
What is financial statement trend analysis and why does it matter for stock investors?
Financial statement trend analysis means tracking a company’s key financial ratios across multiple quarters or years instead of reading a single snapshot. It matters because one year of data can be misleading companies have legal flexibility in how they report earnings, and a single strong or weak result rarely reflects the true direction of the business. Trends over 8 to 12 quarters reveal patterns that single data points hide.
What are the most important financial ratios to track over time?
The 4 most useful ratios to track as trends are the current ratio (short-term financial health), debt-to-equity ratio (leverage over time), net profit margin (profitability per dollar of revenue), and working capital turnover (operational efficiency). Tracking each of these across 10 to 12 consecutive quarters gives a far more reliable picture than any single reading.
Can companies legally manipulate their financial statements?
Yes, within accounting rules. Companies have discretion in areas like bad debt reserves, depreciation methods, revenue recognition timing, and write-off scheduling. This doesn’t mean fraud — it means financial statements reflect judgment calls as much as hard facts. Tracking trends over multiple years helps reveal when numbers are being actively managed versus naturally evolving.
Why do stock prices sometimes drop after a company reports good earnings?
The market reacts to results relative to analyst predictions, not to absolute performance. A company that earns 9% returns in a year where analysts predicted 10% may see its stock fall even though 9% is a genuinely strong result. This disconnect between perception and reality is exactly where fundamental investors find opportunity, because the underlying financial trends haven’t changed.
How many years of financial data should I review before investing in a stock?
A minimum of 3 years of annual data or 10 to 12 quarters of quarterly data gives you enough history to identify meaningful trends. Less than that, and you’re making decisions based on too short a window to distinguish between a trend and a temporary fluctuation.
How does a beginner investor access historical financial statement data?
SEC EDGAR (the Securities and Exchange Commission’s free public database) contains every annual and quarterly report filed by US-listed companies. Most financial data sites like Morningstar, Macrotrends, and a company’s own investor relations page also provide multi-year historical financials in easy-to-read formats.
The Real Takeaway
Analyzing stock fundamentals using financial statement trends gives you something no short-term indicator can: actual evidence of where a business has been and where it’s heading.
Single-year numbers are a starting point. Trend lines are the substance. A current ratio that’s been sliding for 3 years, a profit margin quietly thinning, a debt load creeping upward these patterns appear in the data long before they show up in a headline, an analyst downgrade, or a stock price collapse.
The investors who find good companies early are almost always the ones who read the trends nobody else bothered to follow.
Expert Tip
Before you look at any individual ratio, pull up 10 to 12 quarters of that ratio for the same company and graph the direction. Just draw a simple line. A ratio that’s been declining for 8 straight quarters is a declining business no matter how good this quarter’s absolute number looks. That direction is your most reliable signal, and most retail investors never bother to check it.