
How to pick stocks without fundamental analysis is a question most beginner investors never think to ask. Do your homework. Know what the business does before you buy a single share.
That advice sounds responsible. It’s also, in many cases, wrong.
There’s a school of thought that says you can pick stocks, time your entries, and manage your exits without ever knowing what a company actually sells. No revenue models. No sector research. No 10-K. Just price, volume, chart patterns, and a few reliable technical tools.
This article lays out exactly how that approach works, why it makes sense for first-time investors, and what methods hold up in the real world.
Why Fundamental Analysis Isn’t the Only Path
The standard pitch for fundamental analysis goes like this: if you understand the business deeply, you can spot undervalued stocks before the market does. Buy low, hold long, collect gains.
The problem? Even the professionals get this wrong at scale.
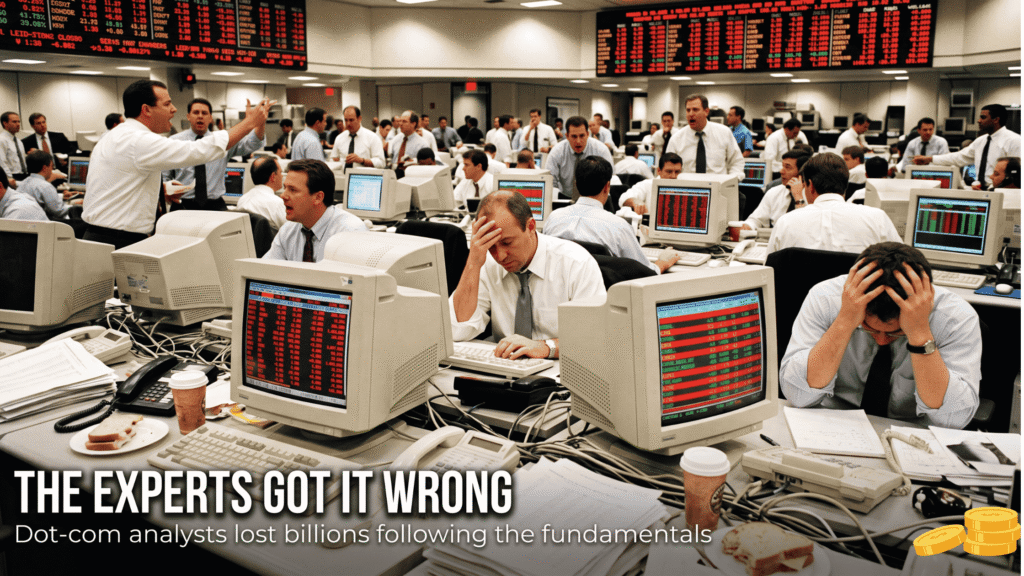
The dot-com era is the textbook example. Analysts at major brokerages ran detailed projections on Internet companies. They modeled revenue growth, estimated market share, built 5-year forecasts. Then watched those same stocks fall 90% or more. Some went to zero. The “fundamentals” said buy. The price said run.
Fundamental analysis is only as good as the analyst doing it. And most analysts have vested interests, incomplete information, or both. A CEO on CNBC saying the company’s future looks bright isn’t a data point. It’s marketing.
Technical analysis doesn’t care about any of that. A chart doesn’t lie about where buyers and sellers actually showed up. Price is the one thing you can trust completely, because it reflects what people actually paid, not what they claimed to think.
How to Pick Stocks Without Fundamental Analysis: The Technical Approach
Technical analysis is often presented as complicated, full of exotic indicators and dense charts. It doesn’t have to be.
The core of the technical approach is simple: use price history to identify when to buy and when to sell. That’s it. You’re asking 2 questions: Is this stock moving in the right direction? And am I entering at a reasonable point within that move?
The role of price charts
A price chart is just a history of what happened. It shows you where a stock was trading, how fast it moved, and where buyers and sellers showed up repeatedly.
The most common chart for stock traders is the OHLC bar chart: each bar shows the open, high, low, and close for a given time period (daily, weekly, intraday). Stacked together, these bars form a picture of momentum, trends, and turning points.
Charts help you answer questions like:
- Has this stock been trending up or just bouncing around randomly?
- Did the price bounce off the same level multiple times? (That’s support.)
- Is there a ceiling the price keeps hitting but can’t break through? (That’s resistance.)
- Is volume rising as the price climbs? (Buyers are actually showing up.)
You don’t need to know whether the company sells software or soybeans to read those things off a chart.
Support and Resistance: The Foundation of Every Entry Decision
If you learn one concept from technical analysis, make it support and resistance. Everything else builds on this.
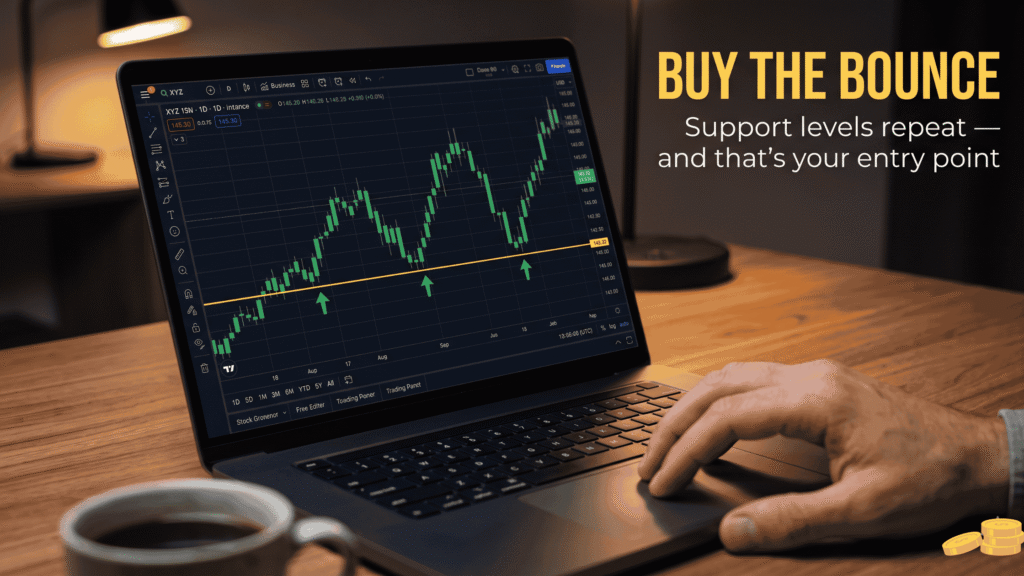
Support is a price level where a falling stock tends to stop falling and reverse higher. Think of it as a floor. Buyers keep showing up at that price. The market has “memory” of that level.
Resistance is the opposite: a ceiling where rising stocks tend to stall and pull back. Sellers keep appearing at that price.
These levels develop because of how human psychology works. If a stock dropped from $40 to $28 and then bounced back to $35, traders who bought at $28 remember that. The next time the stock revisits $28, many of them will buy again. Their collective action creates support.
How to use support and resistance to time your buys
The cleanest entry point in an uptrending stock is at or near support, not after the stock has already moved 15% off its low. Buying near support gives you 2 things:
- A logical stop-loss level (just below support, so you know exactly when you’re wrong)
- A favorable risk-reward ratio before the stock resumes its trend
The mistake beginners make is chasing stocks after they’ve already run. They see the price moving up, feel the fear of missing out, and buy at resistance. Then wonder why they’re immediately underwater.
Buying at support flips that equation. You’re buying where the stock has proven demand, with a defined exit if the level fails.
The Moving Average Channel: A Practical System for Beginners
One of the most practical tools for identifying support and resistance automatically is the Moving Average Channel (MAC).
A moving average smooths out daily price noise by calculating the average price over a set number of days. A 20-day moving average, for example, averages the last 20 closing prices and plots that as a line on the chart.
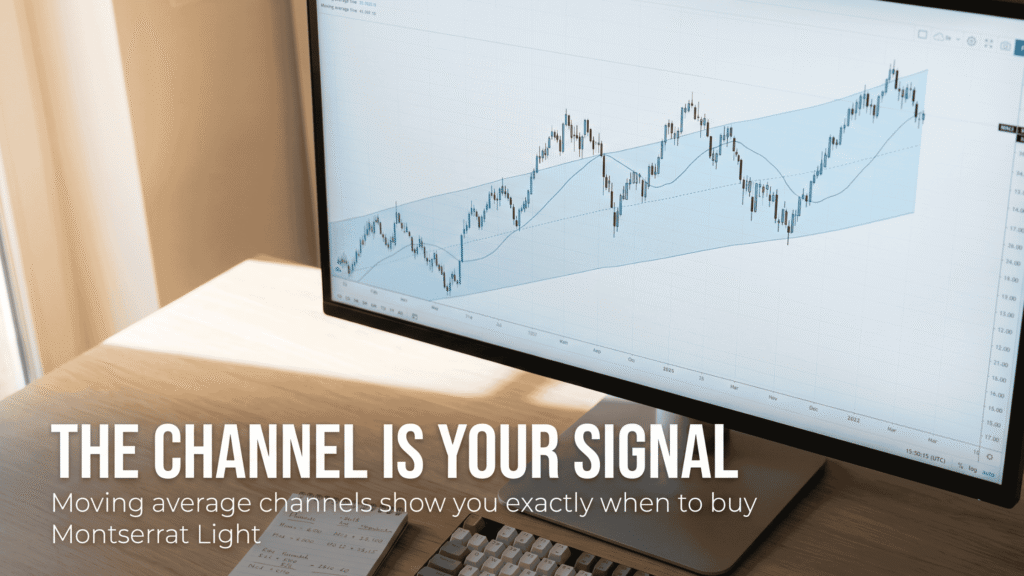
The Moving Average Channel uses 2 moving averages together, typically a shorter-period and a longer-period one. The space between them forms a “channel.” When price is above the channel, the trend is up. When it dips back down to the channel’s upper edge, that’s often a support zone and a potential buy point.
When price falls below the channel entirely, the trend has shifted. That’s often your exit signal.
What MAC buy and sell signals look like in practice
- Buy signal: price is above the moving average channel, pulls back to touch the upper edge of the channel, and then bounces back up
- Sell signal: price drops through the lower edge of the channel on a daily closing basis
This system won’t catch every move perfectly. No system does. But it gives you objective, repeatable criteria for when to enter and when to leave. No guessing. No “I think the stock looks good.”
The MAC has been shown to work across sectors, stock types, and time frames. A few back-tests on well-known names like IBM and Microsoft over multi-decade periods show it generates consistent, tradable signals.
Timing Indicators That Support Your Entries
Beyond support/resistance and moving averages, a few technical indicators add useful confirmation. None of them should be traded in isolation. Think of them as supporting evidence, not standalone signals.
MACD (Moving Average Convergence Divergence)
The MACD measures the relationship between 2 moving averages and plots the difference as a histogram or line. When the MACD line crosses above its signal line, it’s a bullish signal. When it crosses below, bearish.
Where it’s most useful: confirming that a stock is gaining momentum after pulling back to support. If the MACD is turning up at the same time price is bouncing off a support level, that’s 2 things pointing in the same direction.
Stochastics and RSI
Both the Stochastic Indicator and the Relative Strength Index (RSI) are momentum oscillators. They measure whether a stock is “overbought” or “oversold” relative to recent price history.
An RSI below 30 generally indicates a stock is oversold and may be due for a bounce. Above 70, it may be running hot.
These work best in range-bound markets. In a strong trend, a stock can stay “overbought” for months. Don’t fight a strong trend just because the RSI is high.
Accumulation/Distribution (A/D)
This indicator tracks whether money is flowing into or out of a stock based on where price closes within its daily range, combined with volume. If a stock’s price is flat but the A/D line is rising, big buyers are accumulating quietly. That’s often a setup for a future price move up.
Dollar Cost Averaging: The Technical Version
Most people know dollar cost averaging (DCA) as a passive strategy: buy $200 of an index fund every month no matter what. Set it and forget it.
There’s a more active version that combines DCA with technical signals.
Instead of buying blindly on a schedule, you buy a fixed dollar amount each time the stock hits a historically low price level, confirmed by a technical indicator showing the trend may be turning. You take partial profits when the price rises to historically high levels, rather than holding forever and hoping.
For blue-chip stocks with long, reliable price histories, this approach can be powerful. You’re using the same discipline as passive DCA but with smarter entry and exit points.
The best candidates for this approach: stocks that have been through 5 or more complete up-and-down cycles over 20+ years. Consistent businesses with long track records. Not speculative growth stocks where the price history is only 3 years old.
The Role of Volume in Confirming Price Moves
Price doesn’t mean much without volume context. Volume is the number of shares traded during a given period. It tells you how much conviction is behind a move.
A stock rising on heavy volume is a healthy move. Buyers are showing up in size. A stock rising on thin volume is suspect. It might just be drifting with no real buying pressure behind it.
Key volume signals to watch:
- High volume on a breakout: if a stock clears a resistance level on 3-5x average daily volume, that’s a real breakout, not a head fake
- Low volume on a pullback: if price dips back toward support but volume is light, sellers aren’t motivated. That’s a good setup for buyers to step back in.
- Volume expansion at support: when a stock hits support and volume suddenly jumps, that often means smart money is accumulating
Volume confirms or contradicts what price is doing. Use both together.
What to Actually Look for When Scanning Stocks
Technical stock picking still requires a starting list. You’re not going to look at all 6,000+ stocks on US exchanges. Here’s a practical screen that most charting platforms can run:
- Price above a 200-day moving average (eliminates stocks in long-term downtrends)
- Average daily volume above 500,000 shares (avoids illiquid stocks that are hard to exit)
- Price pulled back 5-15% from a recent 52-week high (in the buying zone, not chasing)
- RSI between 40-60 (not overbought, not in freefall)
That filter typically narrows thousands of stocks down to a manageable list of 20-50. From there, you pull up the chart and look for clean support levels, a healthy trend, and confirming indicators.
For lower-priced stocks (under $10), the same rules apply with a few additions: check institutional ownership, look for stocks where insiders are buying rather than selling, and be cautious of stocks with very high short interest unless you understand what you’re trading.
The One Thing That Kills More Trades Than Bad Analysis: Discipline
Here’s where most beginners get tripped up. The analysis is often fine. The method works. The entry was solid. Then the stock drops 5% and fear kicks in. They sell. Then the stock recovers and continues to its target.
Or the opposite: the stock drops 15% past their stop-loss level, they hold because they “believe in the trade,” and it goes to 30% down.
Trading discipline has 3 levels:
Level 1: Entry discipline. Only enter trades that meet your criteria. If the stock doesn’t hit support, don’t buy. If the indicator hasn’t confirmed, wait.
Level 2: Stop-loss discipline. Before you buy any stock, know exactly where you’ll sell if you’re wrong. Write it down. When it hits that level, sell. No negotiations. No “let me give it another day.”
Level 3: Profit-taking discipline. Decide in advance where you’ll take profits. Either at a predetermined price target or when a technical sell signal fires. Greed is just as dangerous as fear.
The stop-loss is not optional. Losing $200 on a planned stop is nothing. Holding a losing stock for 6 months hoping it comes back is how small accounts become empty accounts.

How Much Money Do You Actually Need to Start?
The honest answer: more than you think, but less than you fear.
$500 is technically enough to open a brokerage account with most online brokers. But it leaves you almost no room to absorb even a single bad trade without damaging your ability to continue.
$1,000 is better. You can buy odd lots and diversify a bit, but you’re still limited.
The real starting point where you have meaningful flexibility is around $3,000. At that level, you can absorb a few losses without wiping out, pay commissions without them eating a significant percentage of each trade, and hold a small portfolio of 2-3 positions at once.
If you only have $500 right now, put it in a low-cost index fund or mutual fund and let it sit while you save. Coming to the market undercapitalized is a great way to get kicked out early.
Can You Do This Without a Computer?
Yes. Entirely.
Long-term investors can do very well checking charts weekly or even monthly. In some ways, less screen time helps. Investors who check their portfolio every hour make worse decisions because they react to noise instead of signal.
A weekly chart review, a clear set of rules for entries and exits, and a stop-loss in place for every position is enough of a system to produce consistent results over time. The market doesn’t reward complexity. It rewards discipline and consistency.
Frequently Asked Questions
Can you really pick stocks without knowing anything about the company?
Yes, for the purposes of timing entries and exits, the business fundamentals are often irrelevant. A chart shows you where real buyers and sellers showed up, which is more reliable than projections or analyst opinions. Many successful traders have no idea what the companies they trade actually do.
What’s the difference between technical and fundamental stock analysis?
Fundamental analysis focuses on the company itself: earnings, revenue growth, competitive position, management quality. Technical analysis focuses on price behavior: trends, support, resistance, volume, and momentum. Both are valid approaches. Technical analysis is often faster, more objective, and easier for beginners to apply consistently.
What is a stop-loss and do I really need one?
A stop-loss is a pre-set price at which you sell a stock to limit your losses. Yes, you need one on every trade. The single most common reason small investors blow up their accounts is holding losing positions too long, hoping they’ll recover. A stop-loss removes emotion from that decision.
How long does it take to learn technical analysis well enough to trade?
A solid basic framework, like reading OHLC charts, identifying support and resistance, and using 2-3 indicators, can be learned in a few weeks. Applying it consistently with discipline takes longer. Plan for 3-6 months of paper trading (simulated trades with no real money) before risking real capital.
Is technical analysis better than fundamental analysis for beginners?
For beginners, yes, in most cases. Technical analysis gives you clear, objective rules: buy here, sell here, stop out here. Fundamental analysis requires a much deeper understanding of accounting, valuation, and industry dynamics to apply correctly. Mistakes in fundamental analysis are often invisible until they’re expensive.
What are the best free tools for technical stock analysis?
TradingView offers free charting with most major indicators. StockCharts.com has strong scanning and educational resources. Finviz is excellent for screening stocks by technical criteria. All 3 are free at the basic level.