
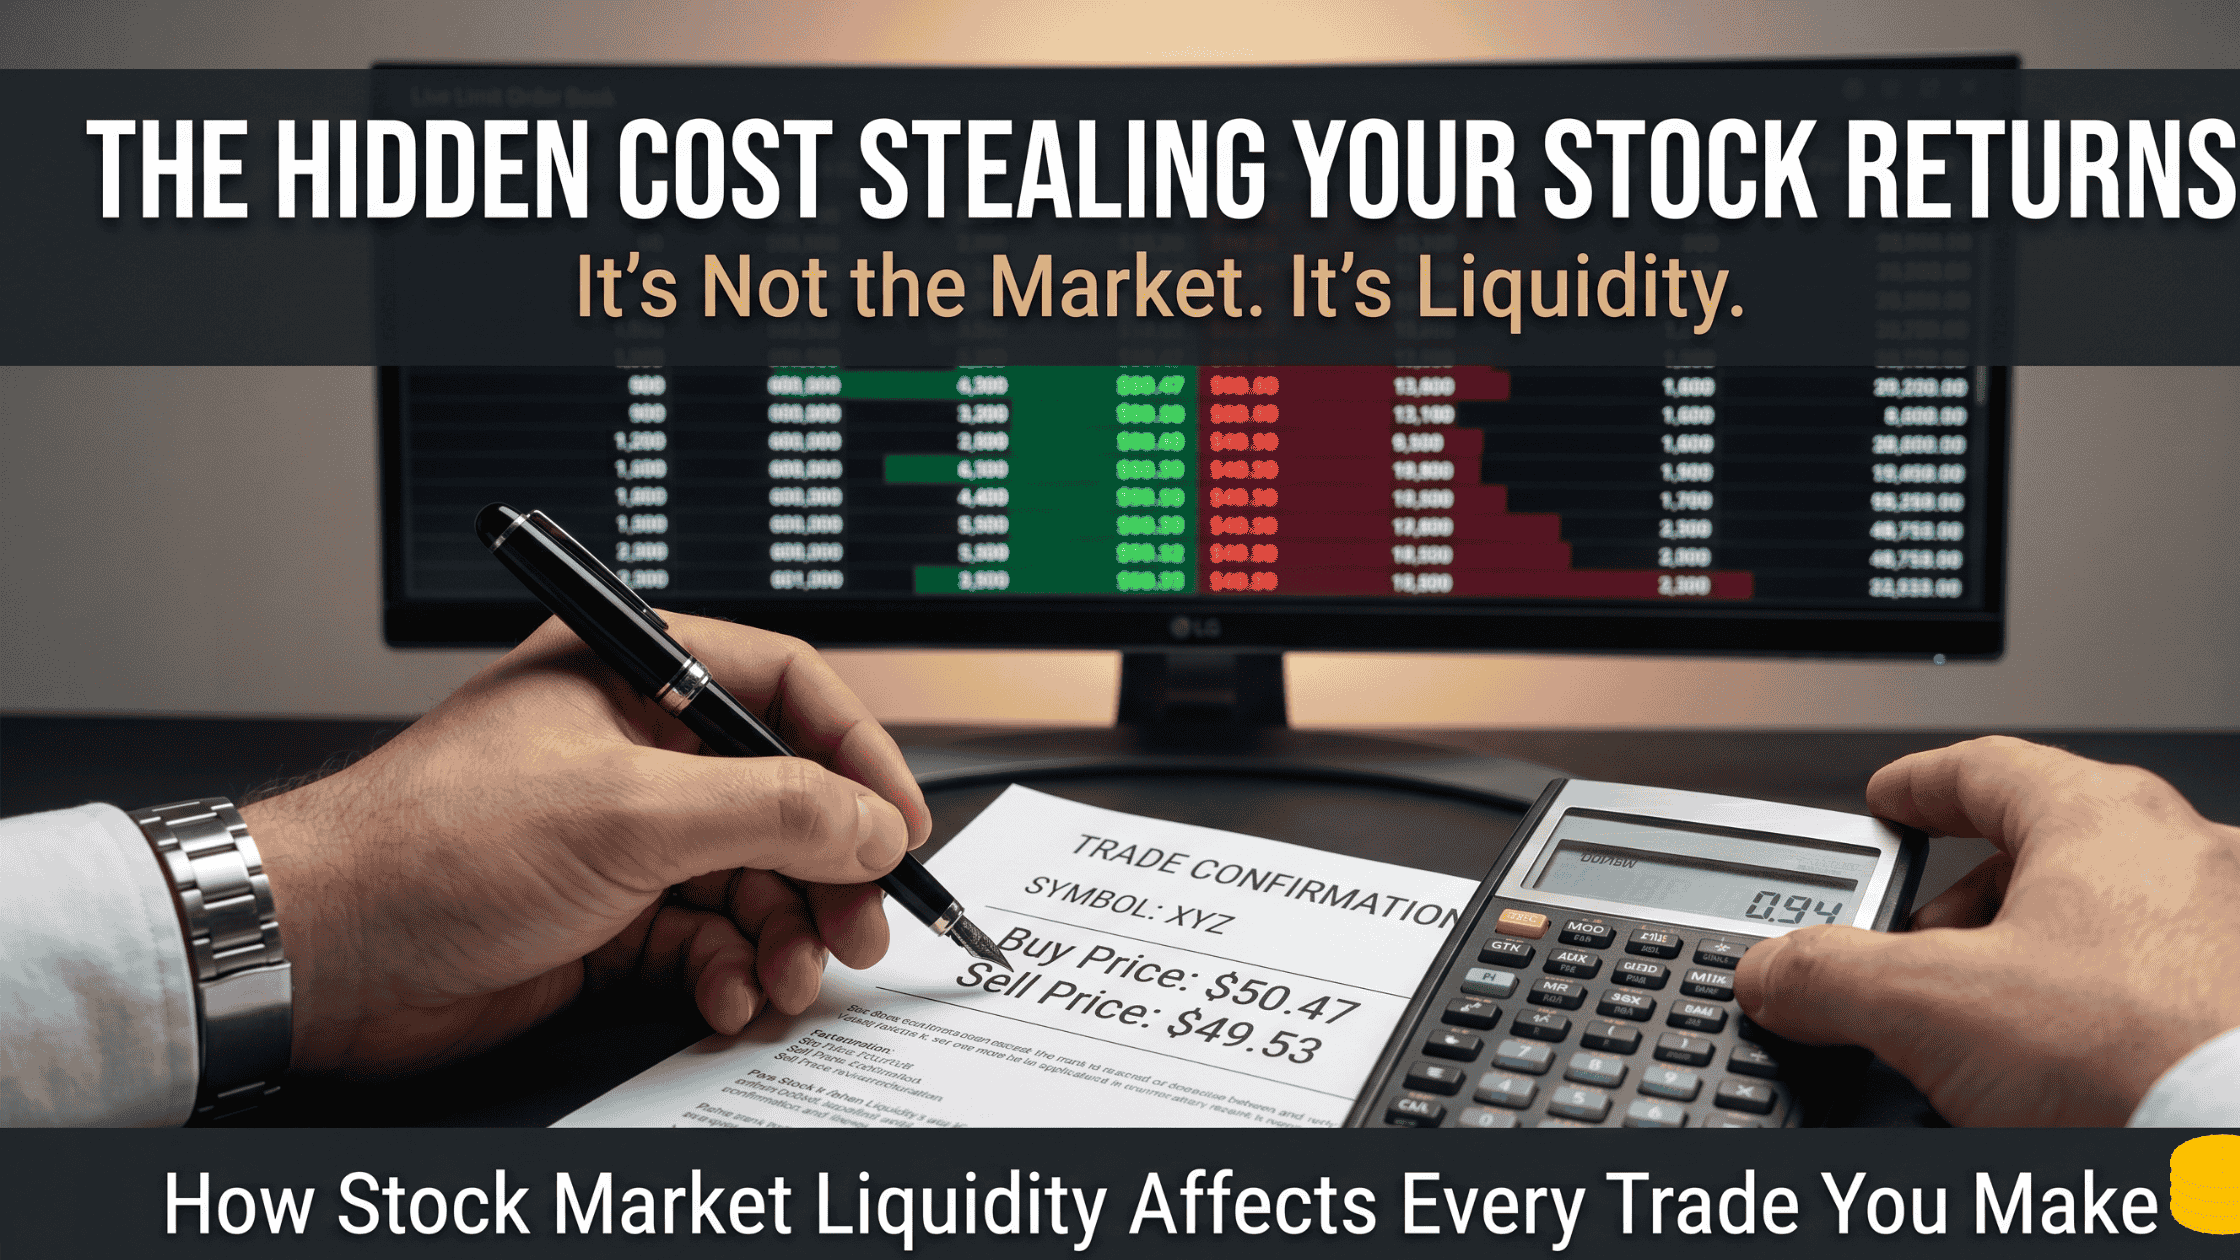
How stock market liquidity affects your trades is one of the most underestimated topics in retail investing. Everyone learns about picking stocks. Almost nobody learns about the invisible costs that drain returns every single time they buy or sell costs directly tied to liquidity.
A portfolio manager at JPMorgan-affiliated research group Plexus found that total transaction costs average 1.57% per trade. On a round-trip (buying then selling), that doubles to over 3%. For a stock expected to return 10% annually, that wipes out nearly a third of the return before a single market move happens.
This article explains exactly how liquidity works, why it affects the price you actually pay (not just the price you see), and what you can do about it.
What Stock Market Liquidity Actually Means
Most definitions say liquidity is “how quickly you can convert an asset to cash.” That’s technically true but almost useless in practice.
A better way to think about it: liquidity is how much it costs you to trade. A liquid market lets you buy at a fair price and sell at a fair price, quickly, without moving the market against you. An illiquid market makes you pay more to buy and accept less to sell every single time.
Researchers measure liquidity across 3 specific attributes:
- Depth and breadth orders stacked at prices close to the current price, in meaningful volume. Tight bid-ask spreads exist when a market has depth. Wide spreads signal thinness.
- Resiliency how fast the market returns to normal after a large order moves it. A resilient market absorbs shocks and recovers quickly. A thin market stays disrupted longer.
- Tightness the difference between the best buy price (bid) and best sell price (ask) at any moment. The bid-ask spread is the most direct measure of liquidity cost.
Understanding these 3 attributes tells you far more about a stock’s trading environment than its price alone.
How Stock Market Liquidity Affects Your Trades Through Hidden Costs
Here’s what most retail investors don’t realize: the price shown on your screen is not the price you pay. There’s a gap between the quoted price and your actual execution price and that gap is liquidity cost.
There are 3 components to understand.
The Bid-Ask Spread
Every stock has two prices at any moment: the bid (highest price a buyer will pay) and the ask (lowest price a seller will accept). The difference between them is the spread.
When you place a market order to buy, you pay the ask. When you sell, you receive the bid. So you’re immediately behind the moment you enter a trade.
For highly liquid large-cap stocks like Apple or Microsoft, spreads are often just 1 cent. That’s almost nothing. For smaller, less-traded stocks, spreads can be 50 cents, $1, or more. On a $20 stock with a $0.80 spread, you’re starting every round-trip trade down 4% before the stock moves at all.
Market Impact
Market impact is the additional cost created when your order is large enough to actually move the price against you.
If you’re buying 1,000 shares of a stock that typically trades 5,000 shares a day, your order represents 20% of typical daily volume. The market doesn’t have enough sellers at the current price to fill you cleanly. So you push the price up as your order works through the available supply. You end up paying more for the later shares in your order than the first ones.
This is why institutional investors pension funds, mutual funds, hedge funds spend enormous resources on execution strategy. A 500,000-share order in a stock that averages 300,000 shares daily doesn’t just get filled. It has to be worked carefully over time, in pieces, to avoid destroying its own execution price.
For retail traders with smaller accounts, market impact is less dramatic but still real in thinly traded stocks.
Opportunity Cost
The third cost is the one nobody talks about. If you delay your trade to try to get a better price, and the stock moves while you wait, that movement is your opportunity cost.
Buyers who wait and miss upward moves, sellers who wait and watch prices fall both are paying opportunity cost. In liquid markets, this cost is small because prices are stable and spreads are tight. In illiquid markets, prices move more erratically and the cost of waiting is higher.
Why Transaction Costs Destroy Returns More Than Most Investors Realize
The 1.57% average transaction cost figure breaks down like this:
| Cost Component | Basis Points | Dollar Amount (on $30 stock) |
|---|---|---|
| Commissions | 17 bp | $0.05 |
| Market impact | 34 bp | $0.10 |
| Delay cost | 77 bp | $0.23 |
| Missed trades | 29 bp | $0.09 |
| Total | 157 bp | $0.47 |
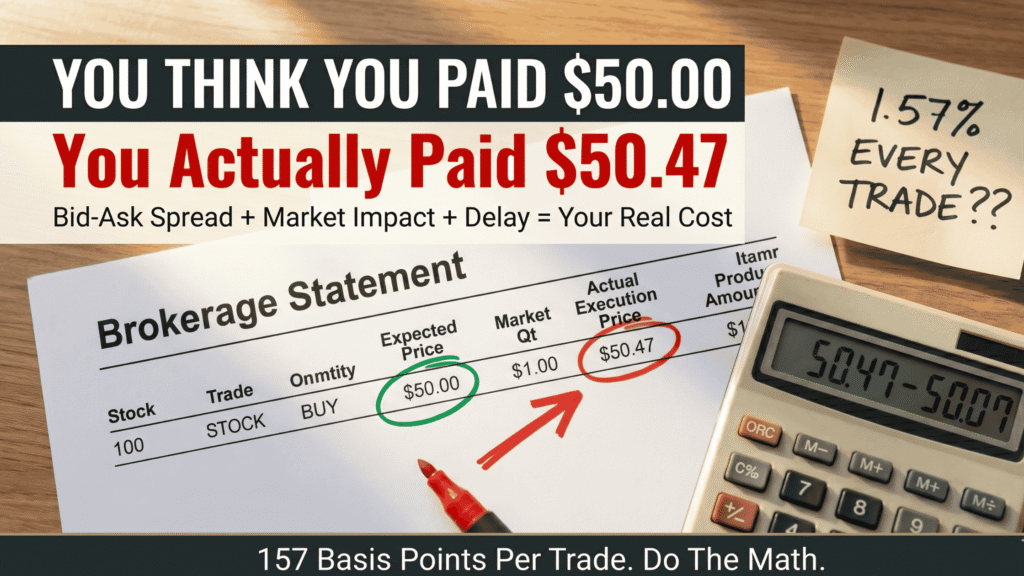
Commissions are the smallest part. Delay and market impact are the real killers and they’re almost entirely invisible to most traders.
Now scale this up. A portfolio manager who expects 10% annual returns on a stock but pays 1.57% to buy and 1.57% to sell ends up with a net return of just 6.86%. That’s a 31% reduction in absolute return. But the reduction in risk premium is even worse if the risk-free rate is 3%, the risk premium drops from 7% to 3.86%, a 45% cut.
This is why Wayne Wagner, a leading transaction cost researcher, described total trading cost as “the largest cost borne by investors over time in most cases larger than management and administrative fees. Yet these figures are never disclosed.”
Most investors obsess over fund expense ratios of 0.10% while ignoring trading costs of 1.5%+ per transaction. The math doesn’t work in their favor.
How Price Discovery Works (And Why It Matters for Retail Investors)
Price discovery is the process by which a market finds the “right” price for a stock after conditions change. It sounds automatic. It isn’t.
In a perfectly frictionless world, every piece of new information would instantly be reflected in price. All investors would agree on what a stock is worth, and price would simply update. That world doesn’t exist.
In real markets, investors have divergent expectations. Some are bullish at $55. Some are bearish at $45. The actual market price emerges from the interaction of their orders and it fluctuates as new orders reveal information about what the broad market actually believes.
This process has direct consequences for retail traders:
At the market open, price discovery is at its most chaotic. Overnight news, pre-market orders, and accumulated demand all collide simultaneously. Research studying 5 major global exchanges found that opening half-hour volatility was roughly twice the average volatility of the rest of the trading day. For the London Stock Exchange, it was nearly 3 times higher.
That elevated opening volatility is not caused by news. Corporate announcements are deliberately avoided during the opening half hour. The elevated volatility is almost entirely caused by the market’s struggle to discover where the price actually belongs which means it’s driven by trading costs and order imbalances, not fundamentals.
The practical implication: retail traders who routinely trade in the first 15 to 30 minutes of the session are trading in the period of maximum price uncertainty and maximum implied cost. The market is actively working against clean execution during this window.
Market Structure: The Part Nobody Explains to Retail Investors
Every trade you make happens within a specific market structure and the structure itself determines how your order gets handled, at what price, and at what cost. Most retail investors have no idea this layer exists.
There are 2 primary market structures.
Order-Driven Markets
In an order-driven market, the prices are set entirely by the orders of investors themselves. When you place a limit order (a specific price you’re willing to pay or accept), you become a liquidity provider you’re adding to the market’s depth.
When you place a market order (buy or sell at whatever price is available), you’re a liquidity taker you’re consuming the depth that limit order traders created.
This distinction matters because:
- Liquidity providers typically get better prices but risk not executing at all or executing slowly
- Liquidity takers get immediate execution but pay the spread and potentially market impact
Knowing which role you’re playing on any given trade is part of understanding your true execution cost.
Quote-Driven (Intermediated) Markets
In a quote-driven market, professional intermediaries called market makers set the bid and ask prices. They stand ready to buy from you and sell to you at their quoted prices, making money on the spread.
Market makers provide a service they create immediacy. You can always trade when a market maker is present, even if no natural buyer or seller is available at that moment. The cost is that you’re paying the spread to the market maker every single time.
Most modern markets are hybrids they combine order book trading with some form of market-maker participation for less liquid securities.
How Institutional Order Flow Affects Retail Traders
Here’s the piece that most retail investors find surprising: the large institutional orders pension funds, mutual funds, hedge funds directly affect the prices you pay as a retail trader, even when you’re not trading the same stocks.
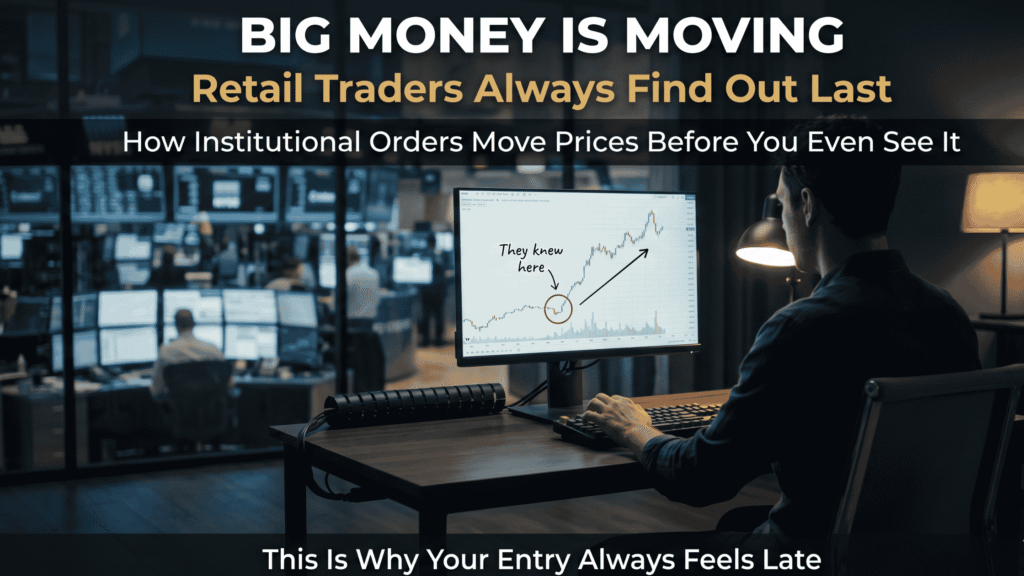
How large orders create noise:
Institutional investors routinely need to buy or sell hundreds of thousands of shares. To avoid pushing the price too far against themselves (market impact), they break these large orders into smaller pieces and work them over hours or days, often through automated algorithms.
This creates a specific pattern: sustained buying or selling pressure that gradually pushes a stock’s price in one direction. Other market participants notice the trend and start trading along with it momentum trading. Price runs further than the underlying value justifies.
Eventually the institutional order is complete. The momentum traders who followed it are now stuck holding a position at inflated prices. When they exit, the price reverses sharply.
This mechanism institutional accumulation, momentum trading, then reversal is one of the primary drivers of short-term price swings that confuse retail investors. It has nothing to do with fundamentals. It’s entirely a function of how large orders interact with market liquidity.
Front-running compounds this. When market participants detect that a large order is being worked, some will buy ahead of it (anticipating upward price pressure) and then sell to the institutional buyer at a higher price. The institution pays more, and the retail investor who also happens to be buying during this period pays more too.
What Good Liquidity Looks Like and How to Check It
Before trading any stock, these are the metrics worth checking.
Bid-ask spread: Look at the live bid and ask for a stock before placing any order. If the spread is more than 0.5% of the stock’s price, that’s a meaningful cost. For a $50 stock, a spread above $0.25 starts to matter.
Average daily volume (ADV): Higher ADV means more natural buyers and sellers, tighter spreads, and less market impact. For active traders, stocks under 500,000 shares average daily volume require significantly more caution about entry and exit costs.
Time of day: Opening and closing half hours are the most expensive times to trade in almost every major market globally. Midday tends to offer the best execution quality for most retail strategies.
Order type selection:
- Use limit orders when execution price matters more than execution speed
- Use market orders only in highly liquid stocks where the spread is negligible
- Avoid market orders entirely in thinly traded stocks the fill could be far from the displayed price
The Liquidity Trap: Stocks That Look Tradeable But Aren’t
This is one of the most expensive lessons retail investors learn the hard way.
A stock can have a reasonable share price, positive news, and apparently good volume on a particular day and still be deeply illiquid in practice.
Signs of a liquidity trap:
- Volume spike on a single day followed by return to thin trading. This creates a one-time opportunity to enter but makes exiting at a fair price nearly impossible once the spike passes.
- Wide intraday price swings on low volume. This is the market struggling to find fair price depth and resiliency are both poor.
- Large spread relative to share price. Any spread over 2% of the share price means you’re fighting a significant headwind from entry.
- Thin level 2 order book. If the visible orders at each price level are small in quantity, a modest-sized trade will punch through multiple price levels.
The cost of ignoring these signals isn’t theoretical. It shows up as entries at bad prices, exits that require significant price concession, and returns that disappoint despite correct directional calls.
FAQ
What is stock market liquidity in simple terms?
Stock market liquidity is how easily and cheaply you can buy or sell a stock without moving its price against you. A liquid stock has many buyers and sellers competing closely on price, which creates tight spreads and smooth execution. An illiquid stock has few active participants, creating wide spreads, larger price moves, and higher hidden costs per trade.
How does liquidity affect stock prices?
Liquidity directly shapes short-term price behavior. Illiquid markets have wider bid-ask spreads, meaning transaction prices bounce between higher buy prices and lower sell prices even when the underlying value hasn’t changed. This creates accentuated short-term volatility that has nothing to do with fundamentals it’s purely a cost of illiquidity.
What is the bid-ask spread and why does it matter?
The bid-ask spread is the difference between the highest price a buyer will pay and the lowest price a seller will accept. When you buy at the ask and later sell at the bid, the spread is the minimum cost you pay just to enter and exit. In highly liquid stocks, spreads are often 1 cent. In thin stocks, spreads can be $0.50 or more a meaningful drag on any trade.
Why is the stock market most volatile at the open?
Research across 5 major global exchanges consistently shows opening half-hour volatility is roughly twice average intraday volatility. This isn’t caused by news corporate announcements are typically avoided in this window. It’s caused by the market’s price discovery process as overnight orders, pre-market sentiment, and accumulated demand all hit simultaneously. For retail traders, this means the opening period consistently produces the most uncertain and expensive execution of the day.
What is market impact in trading?
Market impact is the cost created when your order is large enough to push the price against you as it fills. A large buy order exhausts available sellers at the current price and forces the order to fill at progressively higher prices. For institutional investors with massive orders, market impact can be the single largest component of trading cost. For retail traders, it becomes relevant in low-volume stocks where even modest order sizes represent a meaningful fraction of daily flow.
How can retail investors reduce liquidity costs?
The most effective approaches are: trade stocks with high average daily volume and tight spreads; use limit orders rather than market orders in any stock with noticeable spread; avoid trading in the first and last 30 minutes of the session when execution quality is worst; avoid thinly traded stocks unless the expected gain justifies the higher round-trip cost; and size positions appropriately so your order represents a small fraction of typical daily volume.
Final Verdict
Understanding how stock market liquidity affects your trades is one of the highest-return areas of market education available to retail investors precisely because almost nobody teaches it.
The bid-ask spread, market impact, and delay costs are real, measurable, and often larger than the fees investors pay explicit attention to. Price discovery is genuinely imperfect, especially at market openings, and the consequences show up directly in execution quality. Market structure determines how orders get handled and at what cost. Institutional order flow creates price patterns that affect retail traders even when they’re not directly involved.
None of this requires a finance degree. It requires knowing the right questions to ask before placing any trade.
Expert Tip
Before placing your next trade, spend 60 seconds checking 3 things: the current bid-ask spread, the stock’s average daily volume, and the time of day. If the spread is over 0.5% of the stock price, the volume is below 500,000 shares daily, or you’re in the first or last 30 minutes of the session consider using a limit order instead of a market order or waiting. These 3 checks cost nothing and will, over time, meaningfully improve the prices at which your trades actually execute.
1 thought on “How Stock Market Liquidity Affects Your Trades (And Why Most Investors Ignore It)”