
Quick answer
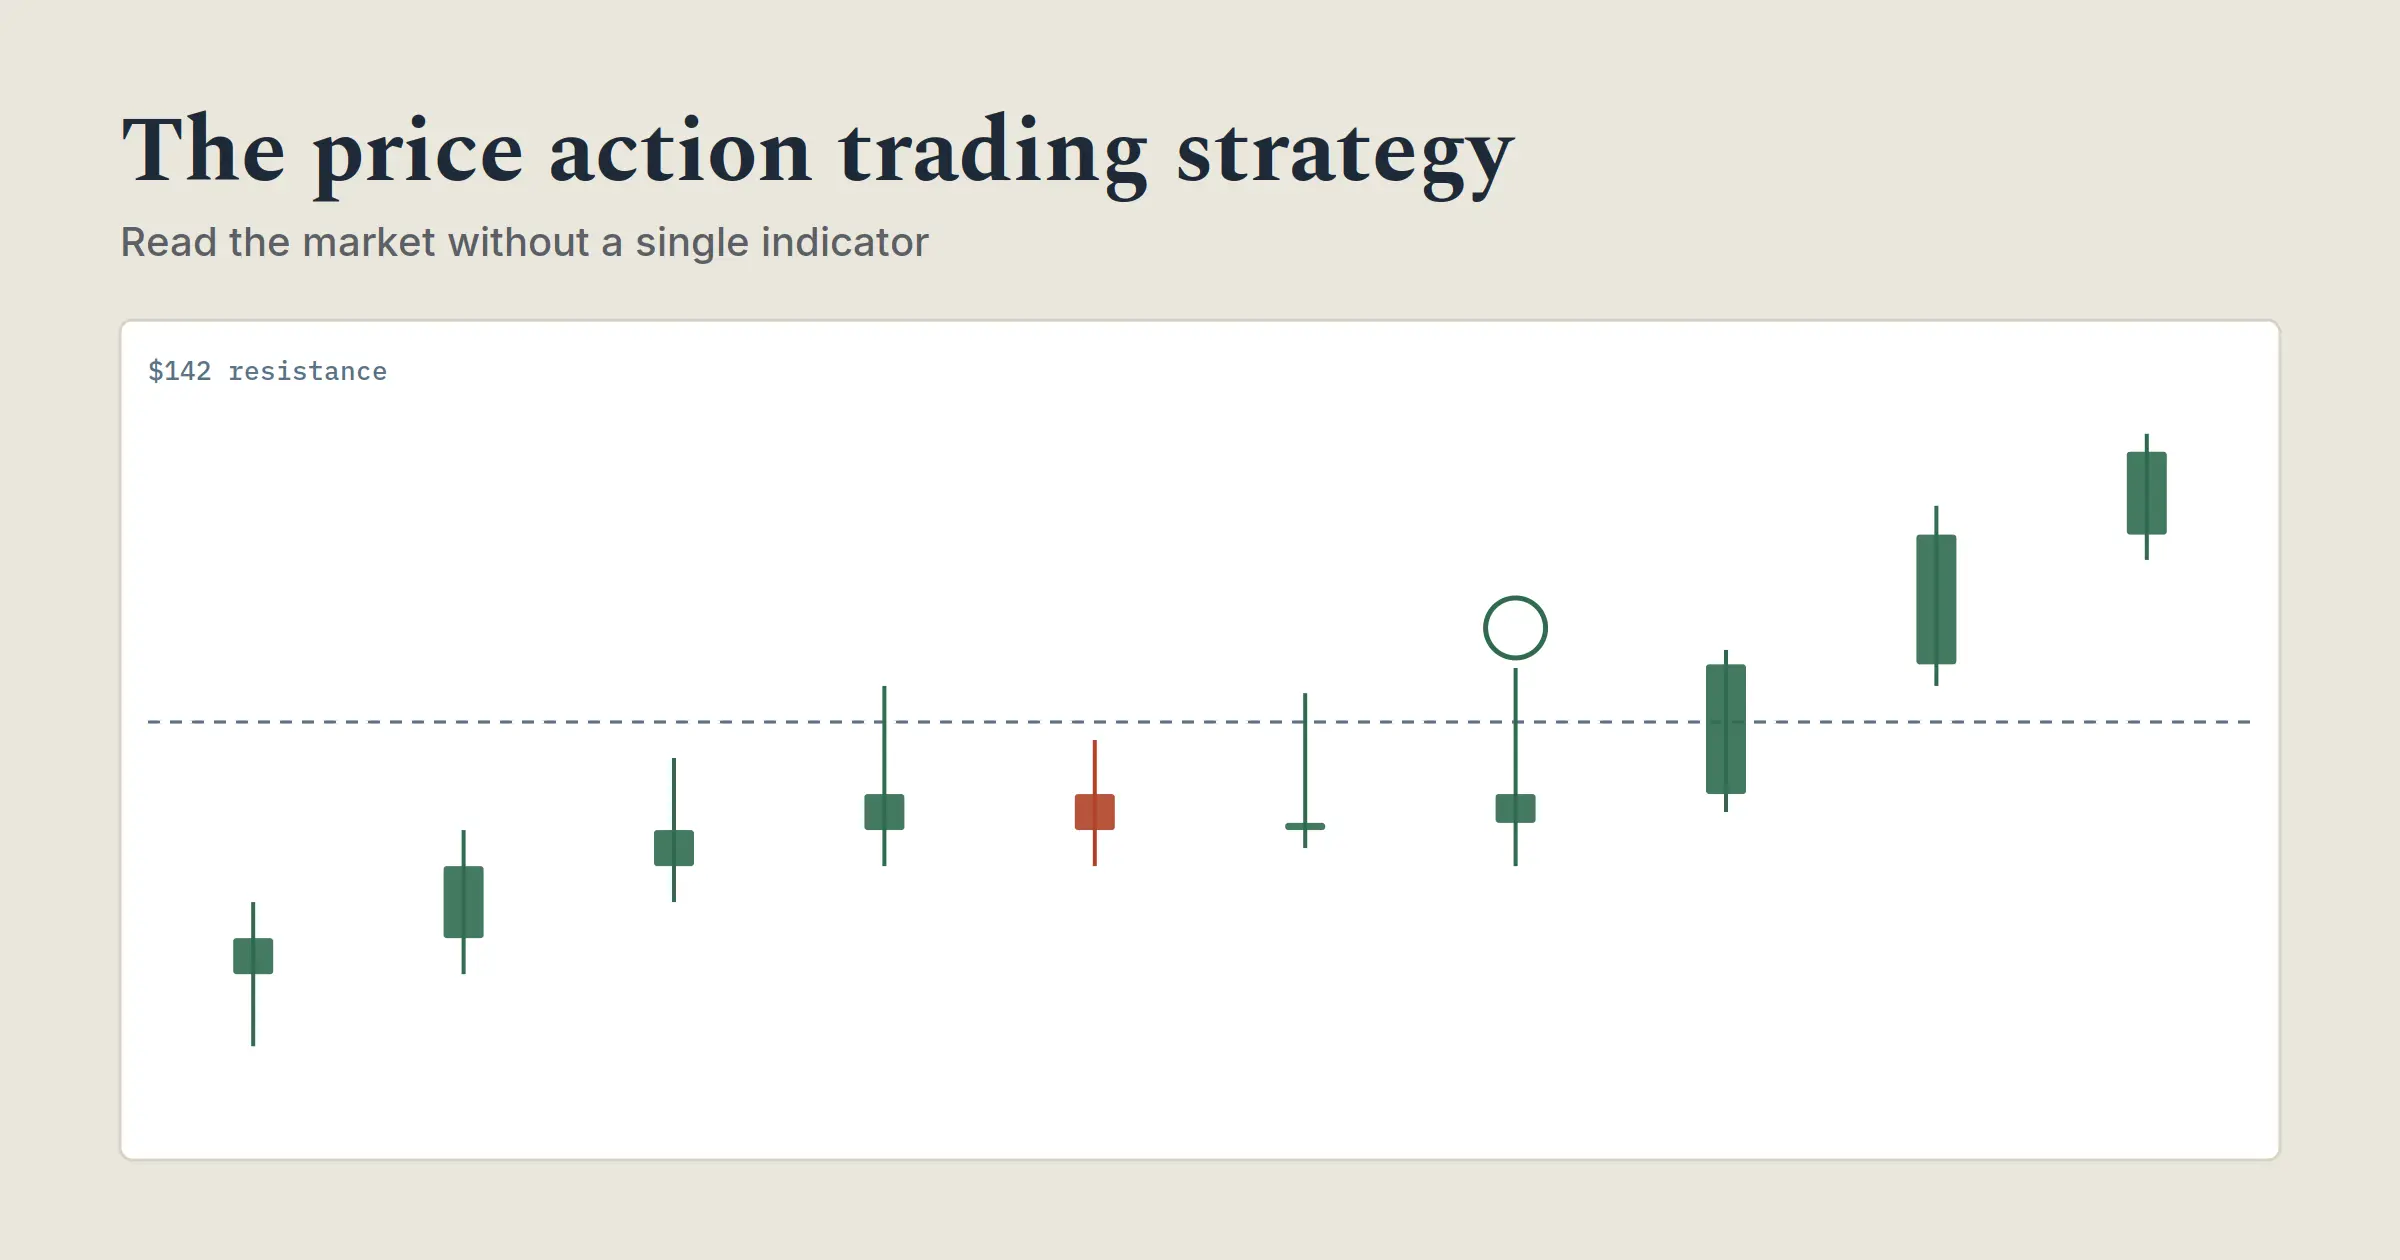
Price action trading strategy means reading buyer/seller dominance, pre-breakout buildup, and pullback depth directly from candles, no indicators required. The framework here skips the usual pin-bar/inside-bar checklist and focuses on three things that actually decide whether a setup works: who’s in control, whether a level was fought over before it broke, and how deep the pullback ran. The table below maps the whole framework in one view; the sections after it go deep on each piece.
| Concept | What you’re checking | Signal it gives you |
|---|---|---|
| Dominance | Are highs/lows climbing or falling, and are pullbacks failing to break the prior swing? | Which side to trade with, and which side to leave alone |
| Buildup | Did price fight at the level before breaking, or walk straight through it? | Whether a break is likely to hold or snap back |
| Break quality | False break, tease break, or proper break? | Whether to trade the break at all |
| Support/resistance flip | Has a broken level started acting as the opposite role? | A logical re-entry point after missing the first move |
| Pullback depth | Shallow retracement or deep one? | How much conviction is left behind the trend |
Most price action guides hand you a checklist of candlestick shapes, pin bar, inside bar, engulfing candle, and call that a strategy. Shapes matter less than most beginners think. A pin bar that forms after a real fight at a level behaves nothing like a pin bar that appears out of nowhere in the middle of a quiet range, even though they look identical on the chart.
This guide skips the shape-naming exercise and goes straight at the four things that actually decide whether a setup is worth taking: who’s in control of the chart, whether a level has been genuinely contested before it breaks, what kind of break just happened, and how much the pullbacks along the way are giving away. None of it needs an indicator. All of it needs a chart you’re willing to sit with longer than five minutes.
What price action trading actually means
Price action trading means making decisions from the shape, position, and behavior of price bars themselves, rather than from a derived indicator.
That doesn’t make indicators off-limits. Plenty of price action traders keep a single moving average on the chart, not as a signal generator, but as a fast visual gauge of pressure: price consistently closing above it suggests buyers have the edge, consistently below suggests sellers do. Used this way, an indicator is a supporting reference, not the thing generating your trade decisions.
The decisions themselves come from watching how price behaves at specific points: does it fight at a level for a while before breaking, or blast through it immediately? Does a pullback retrace deeply or barely dent the prior move? Does a breakout candle close with conviction or limp across the line? None of that comes from a formula. It comes from watching the bars.
Step 1: figure out who’s actually in control
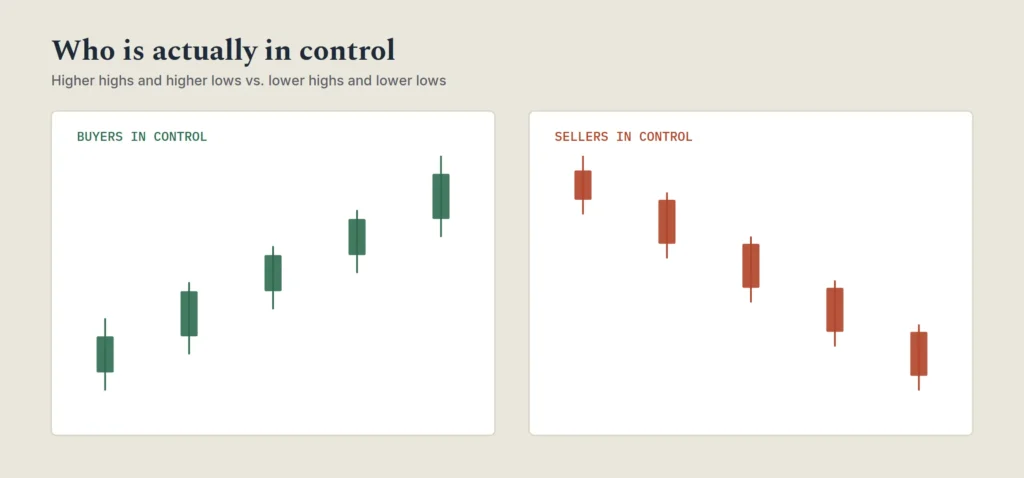
Before looking for any trade, get a read on which side, buyers or sellers, currently has the upper hand. Trading against the dominant side is possible, but it’s a harder game, and it’s worth learning to trade with the pressure before trying to fade it.
| Sign | Buyers in control | Sellers in control | Unclear / transitioning |
|---|---|---|---|
| Highs | Making new highs regularly | Rallies fail to clear the prior high | Highs flattening out, no clear new extreme |
| Lows | Pullbacks fail to break the prior low | Making new lows easily | Lows holding but not rising either |
| Where price sits | Above the last significant low | Below the last significant high | Chopping around a mid-range level |
| What to do | Look for long setups, skip shorts | Look for short setups, skip longs | Wait, don’t force a side |
Dominance doesn’t reverse in a single bar. A market that’s been trending hard for hours or days takes time to actually roll over. The first reversal attempt against a strong, established trend usually fails, and it often takes a second or third attempt before the pressure genuinely shifts. Don’t treat the first wobble in a strong trend as proof the whole thing is over.
Step 2: watch for buildup before a breakout
This is probably the single most useful concept in price action trading, and the one most guides skip past in favor of naming candle shapes.
Before a real, tradable breakout happens, price usually spends time fighting it out right at the level that eventually breaks. This tug-of-war, pushing against a level, getting rejected, coming back, pushing again, is what’s often called buildup or pre-breakout tension.
Buildup matters because it tells you a level is being actively contested, not ignored. A level price approaches once and immediately breaks through, with no prior fight, is a much weaker signal than one that’s been tested repeatedly before finally giving way. The repeated testing traps more participants on the wrong side of the market, and when the level finally breaks, those trapped participants have to exit, which adds fuel to the move.
Example. Say a stock has tried to clear $50 three separate times over two weeks, pulling back each time without ever closing below the swing low that started the attempt. That’s buildup: three failed attempts, no loss of ground. A fourth attempt that finally closes above $50 with a strong candle is a very different animal than a stock that gaps straight through $50 on its first-ever approach to the level.
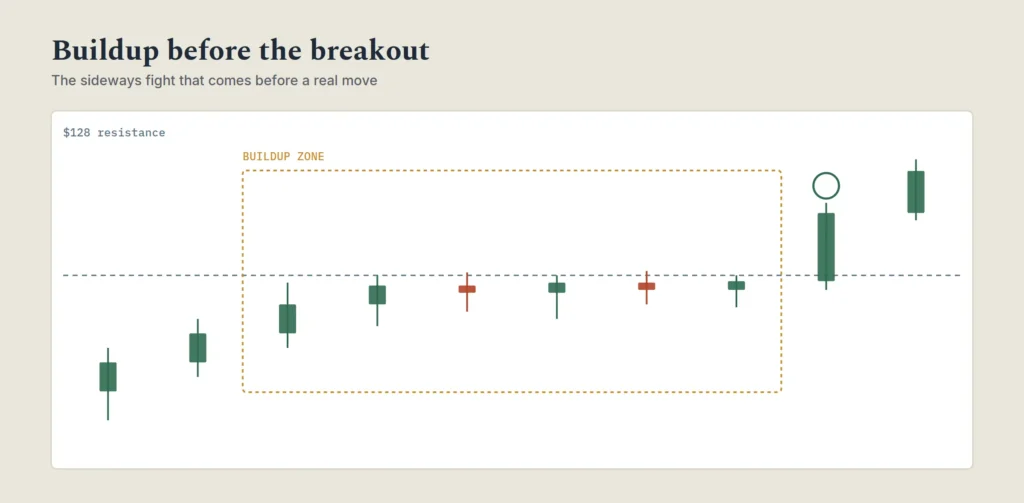
A practical habit: once you notice price boxing itself in around a level, sketch a rough boundary around the high and low of that chop zone and extend it forward. You’re not predicting which direction it breaks. You’re marking the zone so you notice the moment price finally commits to a side.
Step 3: tell a false break from a proper one
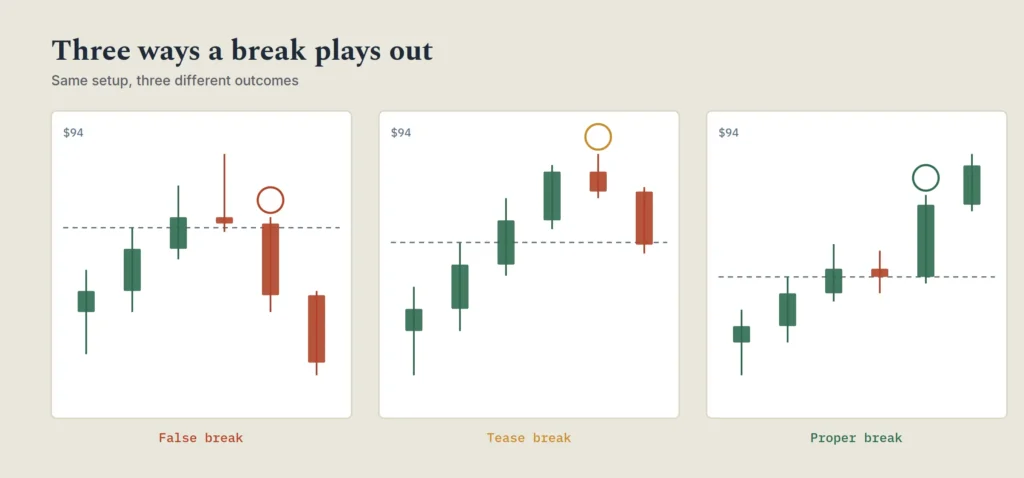
Not every break of a level deserves a trade. Breaks fall into three categories, and the difference between them decides whether a setup is worth taking at all.
| Break type | What happens | What it usually means | What to do |
|---|---|---|---|
| False break | Price pokes through, then reverses almost immediately, often the same bar or the next one | A trap; impatient traders get caught offside | Skip it, or fade it if you’re experienced |
| Tease break | Price breaks, drifts a bit further, then loses steam and drifts back over a few bars | No real follow-through, just a slower version of the same trap | Wait for the retest instead of chasing |
| Proper break | Price closes decisively beyond the level, usually after visible buildup, and continues with conviction | Genuine shift in control | This is the one worth trading |
The tell isn’t the outcome, it’s how the break was set up beforehand. A break can look identical in the first few seconds and still belong to any of these three categories depending on what came before it. That’s why buildup matters: a level with real pre-breakout tension is far more likely to produce a proper break than one that gets casually brushed aside with no fight at all.
Three checks before trusting any break:
- Is it in line with the dominant pressure, or against it? Breaks against dominance need much stronger confirmation.
- Was there buildup at the level before it broke, or did price just walk straight through with no resistance?
- Is the market broadly trending or ranging right now? A break inside a wide, established range behaves differently than a break out of a genuine trend.
Spot the break type
1 / 3Each chart shows price approaching a level. Read the buildup, then call the break before you scroll back to the explanation above.
Support and resistance: same level, different job
Once a support or resistance level is actually broken, it doesn't disappear. It usually flips roles.
A resistance level that finally gives way, after enough buildup, often becomes support the next time price pulls back to test it from above. Broken support tends to act as resistance once price rallies back up to it.
This matters for two reasons. It gives you a logical place to plan an entry after missing the initial breakout, waiting for the retest from the new side rather than chasing the move after it's already run. And it explains why old, well-tested levels keep showing up as relevant long after the initial break: the market has a kind of memory for prices where a real fight happened before.
One habit worth avoiding: treating every prior high or low as a hard wall that must hold or must break. The better approach is neutral. Use these levels as information about where a reaction is more likely, not as a guaranteed signal in either direction.
A trade walkthrough, start to finish
Concepts read differently once you follow them through a real sequence of days. Here's a hypothetical swing setup on the daily chart of a mid-cap stock, walked through candle by candle.
| Day | Price action | What it means |
|---|---|---|
| 1-3 | Stock rallies from $205 to $211, closing higher each day | Buyers in control, dominance established |
| 4 | Tests $214, closes at $211 | First buildup touch, rejected but no ground given back |
| 5-6 | Tests $214 twice more, closes each time between $212-$213 | Buildup deepens, level clearly being contested, not ignored |
| 7 | Closes at $213, just under the level again | Third rejection, tension still building |
| 8 | Opens at $213, pushes to $218, closes at $217.50 | Decisive close well clear of $214 with a strong body: a proper break |
| 9-10 | Continues to $220, then $222, no meaningful pullback | Confirmation: dominant side didn't hesitate after the break |
The entry here isn't day 1, and it isn't the moment price first touches $214 on day 4. It's the close on day 8, after three failed attempts already built real tension at the level. A trader entering on day 8's close, with a stop just under that candle's low around $212.50, is risking roughly $5 to reach for a target based on the next visible resistance above $222, likely a 3:1 reward-to-risk setup or better depending on where that next level sits.
Compare that to a trader who jumped in on day 4's first touch of $214, guessing the level would break immediately. That trade would have been stopped out or sat underwater for three full days waiting for the move that only showed up on day 8. Same stock, same level, very different outcome, and the only variable was whether buildup was respected before acting.
Not every candle carries the same weight
Most beginners treat every candle on the chart as equally important. In practice, most candles are noise, and a handful genuinely matter.
The candles that matter sit in a crucial spot relative to their neighbors, usually at the edge of a buildup zone, at a prior swing high or low, or right at a level that's already been tested more than once. A break of one of these candles, price trading beyond its high or low, carries far more weight than the same size break happening in the middle of an unremarkable stretch of chart.
This is also why drawn lines and boxes, however carefully plotted, are always a bit subjective. Two traders can look at the same chart and draw a pattern boundary slightly differently. The break of an actual candle's high or low, by contrast, isn't up for debate. It either happened or it didn't. That's part of why many price action traders anchor entries to the break of a specific, well-positioned candle rather than to the perforation of a hand-drawn line alone. The line helps you identify where to pay attention. The candle break triggers the trade.
Reading a pullback: shallow vs deep
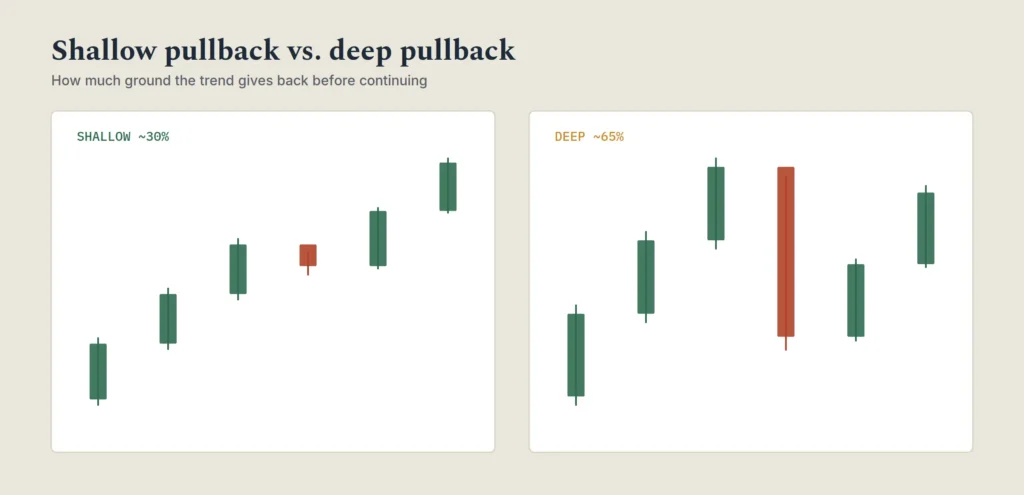
Once a trend is underway, the pullbacks along the way tell you how much conviction is really behind the move.
| Pullback depth | Typical signal | How to treat it |
|---|---|---|
| Shallow (roughly under 40% of the prior swing) | Real strength, dominant side isn't giving up ground | Favor continuation trades |
| Moderate (around 50%) | Normal, healthy correction within an intact trend | Watch for buildup at a technical level before entering |
| Deep (well beyond 50-60%) | Dominant side's grip is loosening | Treat continuation trades with more caution, wait for extra confirmation |
These percentages are a loose reference, not a trigger. The trap to avoid: entering a pullback purely because it's reached some percentage retracement level, with nothing else confirming the trade. That's a guess dressed up as a strategy. The more reliable approach is to wait for the pullback to settle at a technical level, a prior support or resistance zone, a round number, the area around a moving average, and show buildup there before assuming it's done correcting.
Why the 5-minute chart is a different animal than the daily
Price action principles apply across every timeframe, but the character of the signals changes a lot depending on which one you're watching.
| Timeframe | Setups per session | Noise level | Best suited for |
|---|---|---|---|
| 5-minute | Several per hour in an active market | High: breaks here often mean nothing on a bigger chart | Active day trading with full screen attention |
| Hourly / 4-hour | A handful per day | Moderate | Traders checking in a few times a day |
| Daily | A handful per week to per month | Low | Swing trading, beginners building the skill |
For anyone building a swing trading approach around stocks or ETFs rather than day trading, the same mechanics hold up well on the daily or 4-hour chart, just at a slower pace. Buildup might take days instead of minutes. A pullback might last a week instead of an hour. The clock speed changes. The mechanics don't.
If you're new to this, it's genuinely easier to build the pattern-recognition skill on a slower chart first. Fewer signals to sort through, more time to think before acting, and a lot less temptation to overtrade out of boredom.
Common mistakes in price action trading
| Mistake | Why it hurts | Fix |
|---|---|---|
| Treating every line and box as gospel | A drawn boundary is a judgment call, not a law of physics | Reassess when price ignores it, don't assume the market is broken |
| Skipping the dominance check | Trading against the trend without extra evidence gets run over | Check dominance before every setup, not just the ones that feel obvious |
| Trading every break as a proper one | False and tease breaks vastly outnumber proper ones | Wait for buildup and a decisive close, even if it costs early entries |
| Overanalyzing every bar | Most candles are just noise between the moments that matter | Focus attention where tension is genuinely building |
| Confusing a retracement percentage with a signal | A 50% pullback isn't an entry trigger by itself | Wait for buildup and confirmation at the level, not just the number |
Frequently asked questions
Do I need any indicators at all to trade price action?
No, though many price action traders keep one simple moving average on the chart purely as a visual reference for pressure, not as a signal generator. The trade decisions come from the bars, not the average.
How is price action trading different from trendline trading?
Trendline trading is one specific tool within the broader price action approach, using diagonal lines connecting swing highs or lows to define support and resistance. Price action trading is the wider skill set, reading buildup, dominance, break quality, and pullback behavior, of which trendlines are just one visual aid among several.
Does price action trading work on stocks, or only forex?
The underlying behavior, buyers and sellers fighting at key levels, buildup before real moves, false breaks trapping the impatient, shows up in any liquid market, including individual stocks, ETFs, and indices. Typical pace and retracement depth vary between markets, but the core principles transfer.
What timeframe is best for a beginner to start with?
Slower timeframes like the daily or 4-hour chart are easier to learn on, since they produce fewer signals and give more time to think before acting. Once the concepts feel automatic, moving to a faster timeframe or adding day trading becomes a much smaller leap.
Is trading against the dominant trend ever worth it?
It can be, but it's a harder, lower-probability style best approached once you're already comfortable trading in line with dominance. Fading a trend works best when there's clear evidence the dominant side is running out of steam, not just because a level looks "due" for a reversal.
Putting it together
None of this requires software, a paid signal service, or a course. It requires a clean chart, patience through the boring stretches where nothing much is happening, and the discipline to let buildup do its job before you act on a break.
Start by picking one stock or ETF you already follow and watching it on the daily chart for a few weeks without trading it at all. Note where buildup formed, whether the eventual break was proper, false, or a tease, and how deep the pullbacks ran relative to the prior swing. That kind of unhurried observation, done before any money is on the line, builds the pattern recognition no indicator can hand you directly.
About the Author — Jamaluddin K.A.
Jamaluddin is the founder of The First Time Investor, a US and UK-focused personal finance and investing education site. He covers stock market fundamentals, risk management, and trading strategy for people who want to invest confidently without a finance degree.
Disclosure: This article is for educational purposes only and does not constitute financial advice. Trading on margin involves significant risk, including the potential loss of more money than initially invested. Consult a licensed financial advisor before making investment decisions.