
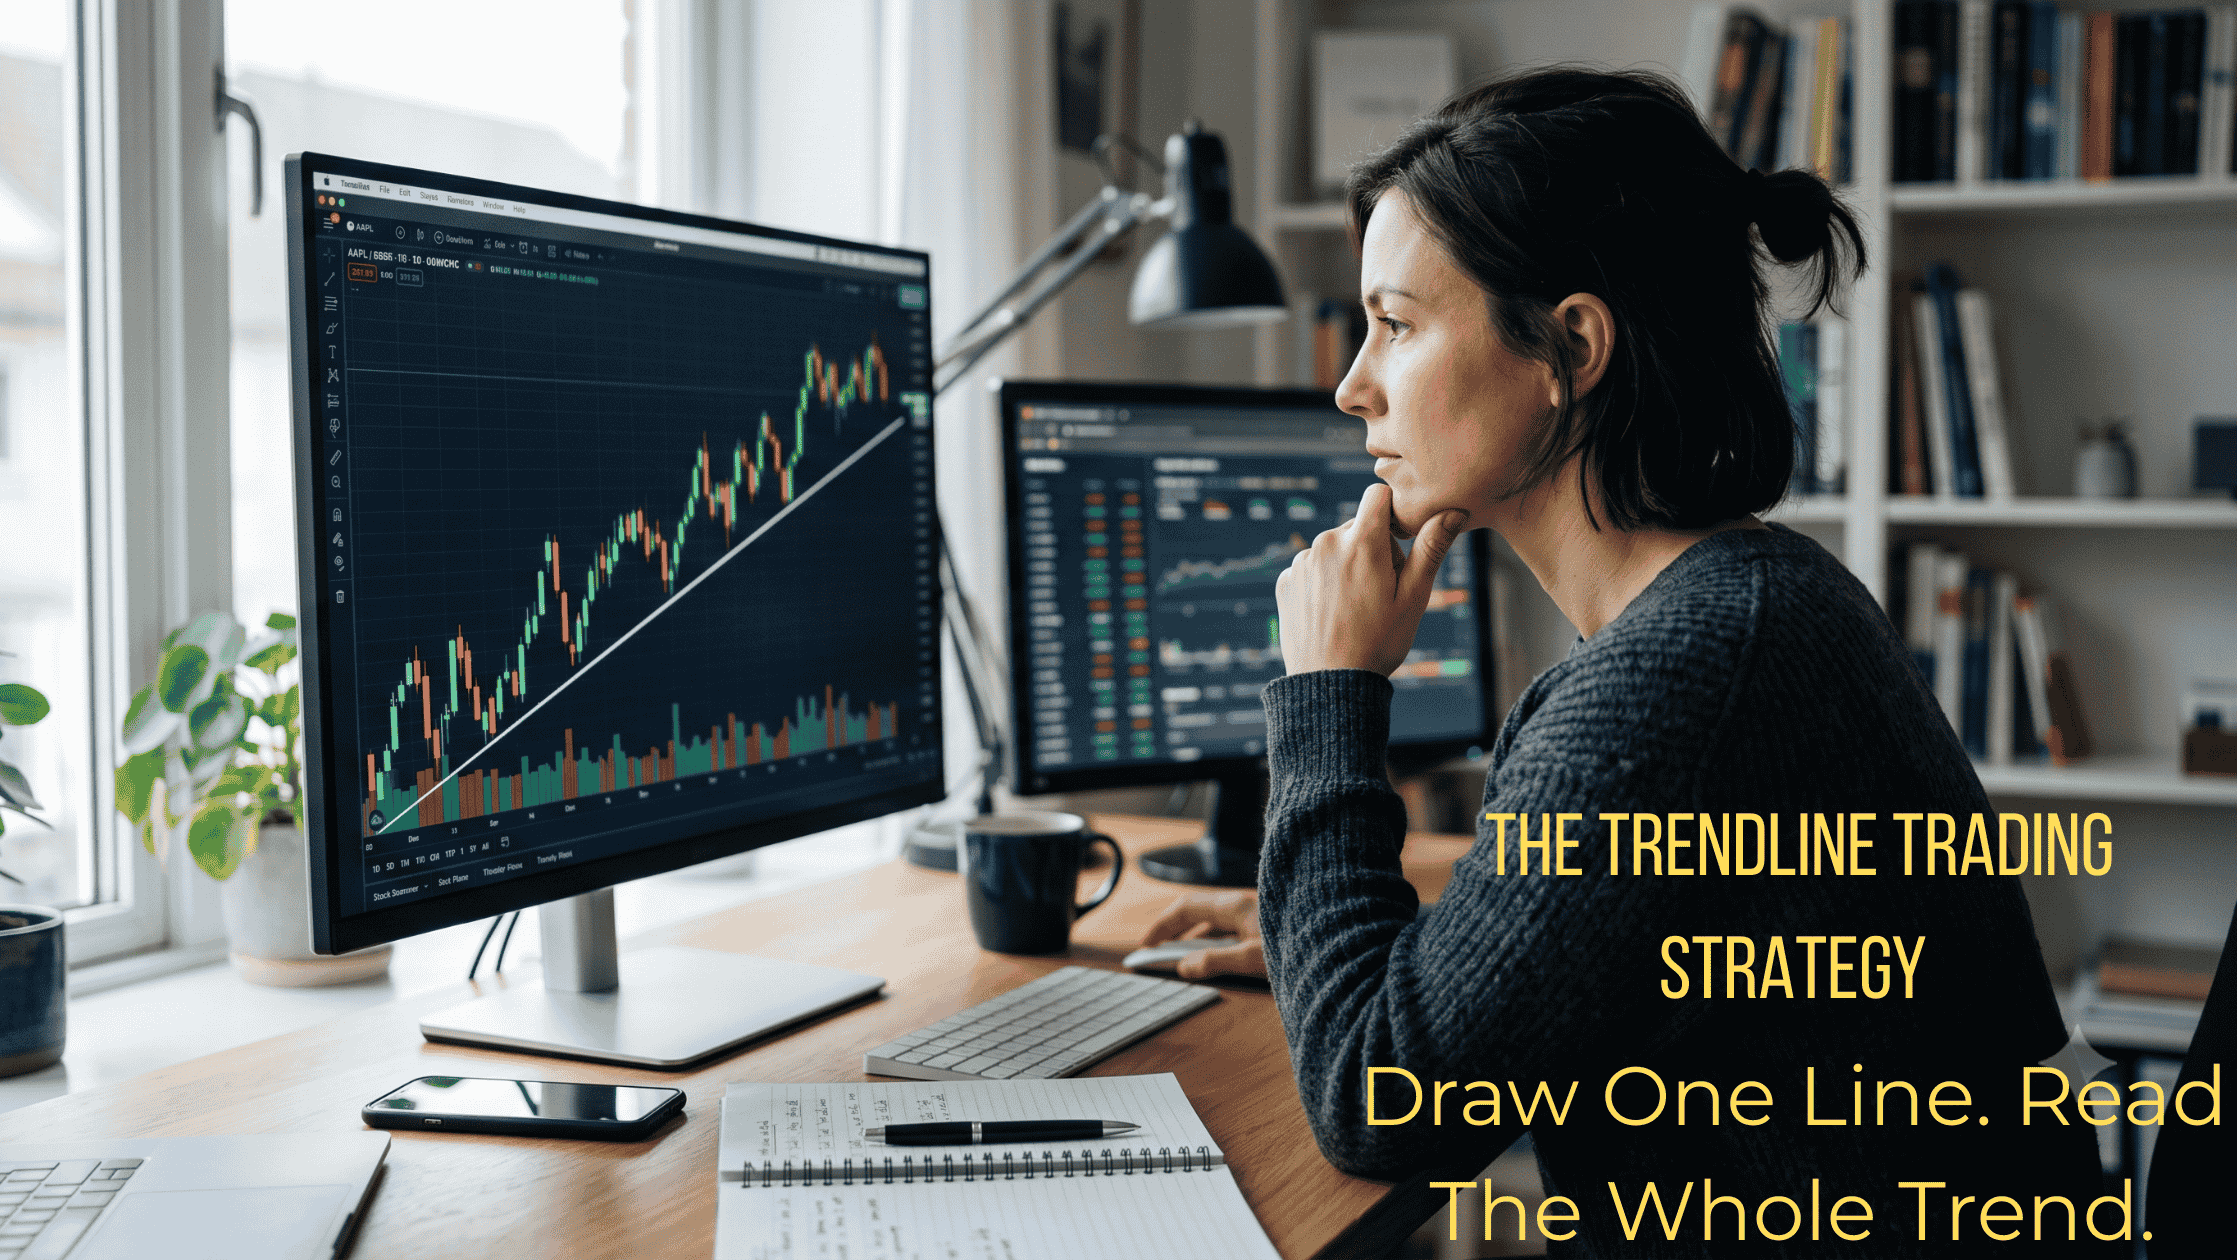
If you’ve ever stared at a stock chart and wondered why some traders seem to know exactly when a pullback is about to end, the answer is usually boring: they drew a line.
Trendlines are one of the oldest tools in technical analysis, and they’re still one of the most useful for beginners. No indicators, no lagging signals, no software subscription. Just price, connected point to point, telling you where buyers or sellers are likely to show up again.
This guide walks through how to draw a valid trendline trading strategy, how to tell a strong one from a weak one, where to place your stop loss, and the mistakes that trip up almost every new trader who tries this. By the end, you’ll have a repeatable process you can apply to any stock, ETF, or index, on any timeframe.
What is a trendline, really?
A trendline is a straight line connecting at least two price points, either two highs or two lows, that shows the general direction the market is moving.
There are two types:
- Uptrend line: connects two or more swing lows (higher lows). It sits below price and acts as support.
- Downtrend line: connects two or more swing highs (lower highs). It sits above price and acts as resistance.
That’s the whole concept. The skill isn’t in the definition. It’s in knowing which highs and lows are worth connecting, and what to do once price comes back to test the line.
How to draw a valid trendline in 2 steps
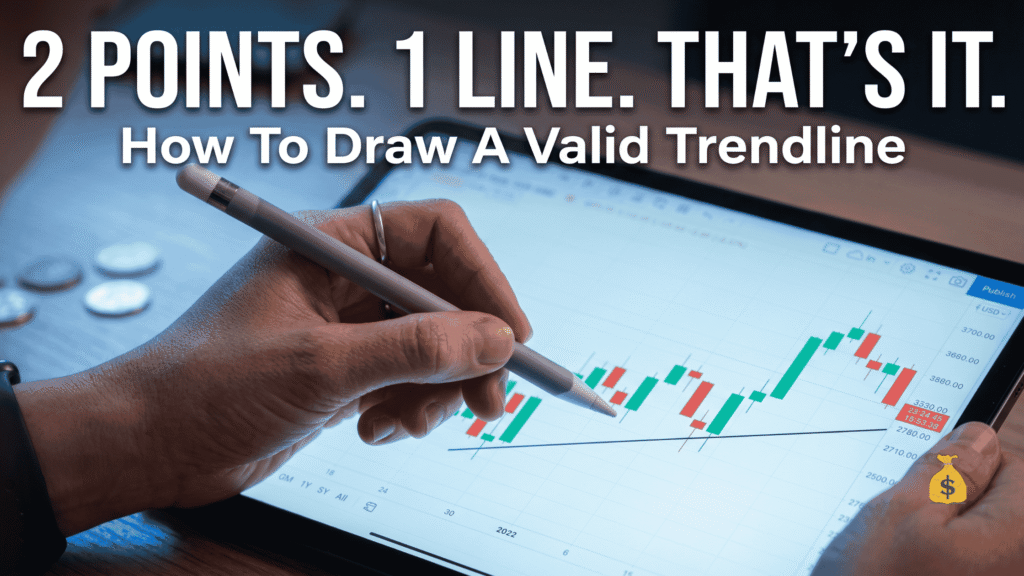
Step 1: Identify obvious peaks and troughs.
Look at the chart and find the swing highs and swing lows that stand out. Not every wiggle in the price counts. You’re looking for turning points that anyone glancing at the chart would notice immediately.
Step 2: Connect at least two of them.
Connect two or more swing lows with a line moving left to right, and you have an uptrend line. Connect two or more swing highs, and you have a downtrend line.
That’s it. The hard part is choosing which highs and lows to use, and that comes down to one rule: significance.
How to pick the right highs and lows
Beginners usually freeze up here. A chart has dozens of small highs and lows, and it’s not obvious which ones matter.
Use this filter:
- For a low to be significant, it should have several higher candles on both its left and right side. It stands out as a clear dip.
- For a high to be significant, it should have several lower candles on both its left and right side. It stands out as a clear peak.
In plain terms: if you’d point to that spot on the chart and a stranger would immediately see the same turning point, it’s significant. If you have to squint, skip it.
Stick to significant highs and lows while you’re learning. Once you’re comfortable, you can start experimenting with smaller, “inner” trendlines drawn from less obvious swing points inside a bigger trend. Those exist too, and experienced traders use them, but they take more practice to spot correctly.
When is a trendline trading strategy valid, and when does it break?
A trendline stays valid as long as price keeps respecting it. It becomes invalid once it’s broken in a way that actually matters, and figuring out what “matters” means is where most beginners get stopped out for the wrong reasons.
Three things to check when price pokes through a trendline:
1. Did the candle close through it?
A wick poking past a trendline means nothing on its own. What matters is the close. If a candle closes clearly beyond the line, that’s a real signal. If it just pierces the line and closes back on the correct side, the trendline usually holds.
2. How big was the candle that broke it?
A long, decisive candle closing beyond the trendline suggests real conviction behind the move. A small, weak-bodied candle that barely closes past the line suggests the market ran out of steam, and price is more likely to snap back and continue respecting the trendline.
3. What does the higher timeframe close look like?
This is the part most beginners skip, and it’s the one that saves the most false signals. A trendline can look broken on a 15-minute or hourly chart and still be perfectly intact on the daily. If you’re watching a shorter timeframe, always check how the next daily or weekly candle closes relative to the line before assuming the trend has changed. A break on a small timeframe that doesn’t confirm on a bigger one usually gets reversed.
Strong trendlines vs. weak trendlines
Not all trendlines are created equal, and this is the single biggest upgrade you can make to how you use them.
Frequency of touches. A trendline that price has already bounced off two, three, or four times is proving itself in real time. Each additional touch that holds adds confidence for the next one.
The slope matters more than people expect. Gently sloping trendlines tend to hold up over and over. Steep trendlines usually don’t, because a steep, aggressive rate of ascent or decline just isn’t something a market can sustain for long. When you see a very steep trendline, treat any bounce off it as short-lived, take profit quickly, or skip the trade altogether if it’s already the second or third touch.
This matters practically: if you’re in a trade off a steep trendline, don’t get greedy. Lock in gains early or move your stop to breakeven fast, because the odds of a sharp reversal go up with every touch.
Combining trendlines with horizontal support and resistance
This is where trendline trading starts to separate from guesswork.
A trendline gives you diagonal support or resistance. A previous swing high or swing low gives you horizontal support or resistance. When the two line up at the same price level at the same time, you get a much stronger case for a bounce or a rejection.
For example: an uptrend line reaches a price level that used to be resistance and has since flipped into support after being broken. Now you have two separate reasons for buyers to step in at that spot instead of just one. The reverse setup works the same way for downtrend lines meeting old support that’s flipped into resistance.
Before entering any trendline trade, glance at the price history around that level. Was there a previous swing high or low sitting right there? If yes, that’s added confirmation. If the trendline is the only thing supporting your entry, treat the trade with a bit more caution.
Entry rules: the conservative approach
Here’s a repeatable framework, adapted for stock and ETF trading rather than fast-moving forex pairs, where timing is less split-second and swing trades can play out over days rather than minutes.
For a long entry (buying a bounce off an uptrend line):
- Draw the trendline connecting at least two swing lows.
- Wait for a candle to close near, touch, or slightly intersect the line without closing clearly below it.
- Place your buy entry just above the high of that candle.
- Place your stop loss just below the low of that same candle, giving it enough room to avoid getting shaken out by noise.
- Set your target near the most recent swing high. If nothing obvious shows up on your current timeframe, check a longer one.
For a short entry (selling a rejection off a downtrend line):
- Draw the trendline connecting at least two swing highs.
- Wait for a candle to close near, touch, or slightly intersect the line without closing clearly above it.
- Place your sell entry just below the low of that candle.
- Place your stop loss just above the high of that same candle.
- Set your target near the most recent swing low, checking a longer timeframe if needed.
If the setup doesn’t trigger, keep adjusting your entry to the next candle’s high or low as new candles form, as long as the trendline itself hasn’t been broken. If it breaks, cancel the setup. Don’t force it.
Where to actually place your stop loss
The most common reason beginners lose money on trendline trades isn’t a bad read on direction. It’s a stop loss placed too close, right where the market naturally shakes out weak positions before continuing in the intended direction.

The rule that solves this: place your stop behind a real support or resistance level, not an arbitrary number of points or percentage away from your entry. Give the trade room to breathe.
If your stop loss ends up too large for comfort on your current timeframe, don’t shrink the stop. Shrink your position size instead. This is the core of good risk management: your stop loss goes where the chart tells you it should go, and your position size is what you adjust to keep your dollar risk consistent.
A rough guide many swing traders use: risk no more than 1-2% of total account value on any single trade. If a wider stop means a smaller position, that’s the trade-off. It’s a far better one than a tight stop that gets you stopped out constantly, only to watch the price go on to hit your original target without you in the trade.
Take profit: fixed targets vs. trailing stops
There are two common ways to manage a winning trendline trade.
Fixed take-profit target. Set your target near the previous significant swing high or low, as covered in the entry rules above. Simple, and it works especially well for beginners who want a clear plan going in.
Trailing stop. Instead of a fixed target, you move your stop loss up (for longs) or down (for shorts) as the trade moves in your favor, locking in more profit as price continues. This can capture much bigger moves than a fixed target, but it also means occasionally giving back a chunk of profit if the trend reverses sharply before your trailing stop catches up.
Neither approach is objectively better. A fixed target is easier to plan around and better suited to choppier markets. A trailing stop shines in strong, sustained trends where cutting profit short at an arbitrary target would leave real money on the table. Many traders use fixed targets while learning and switch to trailing stops once they’ve got a feel for how a given stock or index tends to trend.
A rough risk-to-reward benchmark worth using while you build the habit: look for setups where the potential reward is at least three times the risk. If your stop is $2 below entry and your realistic target is only $2.50 away, that’s not a great trade even if the direction is right.
Which timeframe should you use?
The strategy works on any timeframe, which is part of why it’s so popular with beginners. But the timeframe you pick changes what kind of trader you’re being.
Daily and weekly charts show you the big picture. Trendlines drawn here tend to be more reliable and less prone to noise, because it takes a genuine shift in sentiment to break them. The trade-off is fewer setups and wider stop losses, since a single swing on a daily chart can represent a move of several percent.
Hourly and 4-hour charts sit in the middle. Enough setups to stay active without the whiplash of very short-term charts.
15-minute and 5-minute charts give you far more setups and much tighter stop losses, but also far more false signals. These work best for day traders who can watch the screen closely, not for anyone checking in once or twice a day.
A practical approach: find your trendline setup on a bigger timeframe like the daily or 4-hour chart, then drop down to a smaller timeframe like the hourly to fine-tune your actual entry and stop loss. You’re not trading the small timeframe’s noise. You’re using it to get a tighter entry on a setup that’s already been validated by the bigger picture. This single habit, trading a small timeframe entry within a bigger timeframe setup, is one of the more underrated skills in this whole strategy, because it lets you keep your stop loss tight without giving up on a genuinely strong setup.
Why trendlines work without a single indicator
It’s worth pausing on why this approach holds up at all, since it can feel almost too simple compared to a chart cluttered with moving averages, oscillators, and colored bands.
Indicators are, by definition, calculations built from past price. A moving average is an average of closing prices. An RSI is a formula applied to recent gains and losses. They’re useful, but they’re always a step removed from the actual price action, and that step introduces lag.
A trendline is price itself, drawn directly. It reflects the actual highs and lows where real buyers and sellers already showed up and changed the direction of the market. When price returns to that same diagonal line, you’re watching to see if the same behavior repeats, not waiting for a formula to catch up and confirm it after the fact.
That doesn’t make trendlines infallible. Plenty of trendlines break. But it does explain why traders who’ve been doing this for years often strip their charts down to just price and a few lines, rather than adding more tools on top.
Trendline breakout trading strategy
Everything above covers trading the bounce, buying or selling when price touches a trendline and respects it. The breakout version flips that around: instead of trading the bounce, you trade the moment the trendline actually gives way.
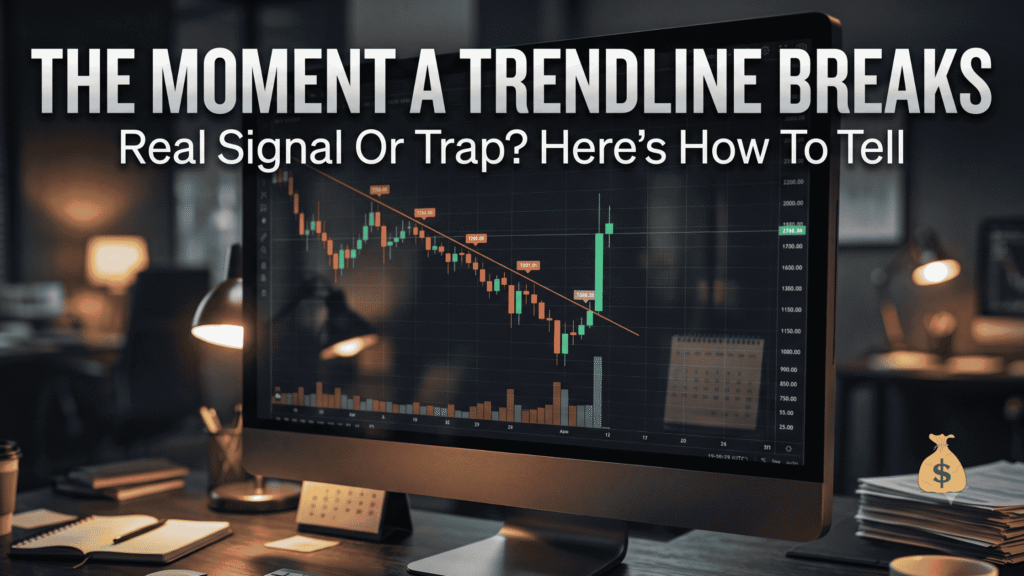
A breakout setup looks like this:
- Find a trendline with several confirmed touches, ideally three or more. The more times it’s held, the more attention traders are paying to it, and the bigger the reaction tends to be once it finally breaks.
- Wait for a candle to close clearly beyond the line, not just poke through it. Revisit the two checks from earlier: the size of the candle’s body and confirmation from a higher timeframe close.
- Enter in the direction of the break, not against it. A downtrend line breaking to the upside is a potential long. An uptrend line breaking to the downside is a potential short.
- Place your stop loss back on the other side of the broken trendline, since that line should now act as new support or resistance in the opposite role.
Breakout trades tend to have a different failure mode than bounce trades. The main risk is the “false breakout,” where price closes past the line for a candle or two, pulls in a wave of breakout traders, then reverses hard back through the line. This is exactly why the candle-size and higher-timeframe-close checks matter so much here. A breakout with a weak, short-bodied candle that barely clears the line unconfirmed by a bigger timeframe is a common trap. Waiting for a genuine, decisive close is slower, but it filters out a large share of these fakeouts.
Trendline channel trading strategy
A channel is just two trendlines running parallel to each other, one drawn off the highs and one off the lows, boxing price into a lane.
Once you’ve drawn a channel, you get two tradable edges instead of one:
- Buy near the lower rail of an ascending channel, sell or take profit near the upper rail.
- Sell near the upper rail of a descending channel, buy to cover or take profit near the lower rail.
The same validity rules from earlier apply to each side individually. A channel is only useful as long as both rails are still being respected. The moment price closes decisively through either rail, treat that the same way you’d treat any other broken trendline: the channel is done, and you look for a fresh one forming instead of assuming the old boundaries still apply.
Channels work best in markets that are trending steadily but not explosively. A channel drawn around a very volatile, choppy stock tends to get violated constantly and isn’t worth trading.
Counter-trend trading with trendlines
Everything covered so far trades with the trend: buying uptrend lines, selling downtrend lines. Counter-trend trading means fading a trendline instead, betting that it’s about to break rather than hold.
This is a harder, lower-probability style of trading, and it’s worth being direct about that rather than dressing it up. You’re betting against the existing direction of the market, which means the odds are stacked against you compared to a standard bounce trade.
If you want to try it anyway, the setups worth paying attention to are the ones already covered under “strong vs. weak trendlines”: a trendline that’s very steep, has already been tested several times, or is meeting a strong, well-established horizontal resistance or support level on the other side. These are the conditions where a break becomes more likely than another bounce. Even then, keep position size smaller than you would on a standard trend-following trade, since you’re deliberately taking the lower-probability side of the setup.
For beginners, the better use of this idea isn’t to trade against trendlines directly, but to use it as a filter: if a trendline is showing multiple signs of weakening (steep slope, many touches, resistance stacking against it), that’s a signal to be cautious about taking a fresh bounce trade on it, even if you’re not ready to trade the breakout itself.
Combining trendlines with RSI and moving averages
Trendlines don’t require an indicator to work, but that doesn’t mean adding one is wrong. Used as a filter rather than a primary signal, an indicator can help you skip weaker trendline setups without changing how you draw or trade the lines themselves.
RSI. When price touches an uptrend line and RSI is also coming up from oversold territory, that’s two independent signals lining up in the same direction instead of one. The reverse applies for a downtrend line touch alongside RSI turning down from overbought. Use RSI to add confidence to a setup you’d already consider, not to generate new setups on its own.
Moving averages. A rising 50-day or 200-day moving average sitting near your uptrend line adds another layer of support at roughly the same price level, similar to the horizontal support and resistance overlap covered earlier. When a trendline, a horizontal level, and a major moving average all line up, that’s about as strong a confluence as this style of trading gets.
The mistake to avoid is stacking on so many indicators that you end up waiting for perfect agreement across five different tools before ever pulling the trigger. Pick one, maybe two, and use them to filter, not to replace the trendline itself.
Is trendline trading actually profitable?
Worth answering honestly: no trading strategy, trendlines included, wins on every trade, and anyone claiming a specific win rate for a discretionary, chart-reading strategy like this one is guessing.
What actually determines whether trendline trading works out for you over time is less about the win rate and more about the risk-to-reward setup you consistently take, covered earlier: stops placed behind real support or resistance, position sizing that keeps any single loss small, and profit targets that give you meaningfully more upside than what you’re risking. A strategy that wins on less than half its trades can still be solidly profitable if the winners are consistently bigger than the losers, and a strategy that wins most of the time can still lose money if the losses are left to run.
Volatility matters here too. A very volatile stock will blow through trendlines more often and produce more false signals, which usually means wider stops and smaller position sizes are needed to trade it sensibly. A calmer, steadily trending stock or index tends to produce cleaner, more reliable trendline behavior. If you’re new to this, practicing on the latter first will make the learning curve considerably less frustrating.
Frequently asked questions
Do trendlines work on stocks, or only forex and crypto?
Trendlines work on any market with enough price history to plot, including individual stocks, ETFs, indices, forex pairs, and crypto. The core behavior, buyers and sellers reacting at the same diagonal level repeatedly, shows up everywhere price is driven by supply and demand.
How many touches does a trendline need before it’s tradable?
Two touches are the minimum needed to draw the line in the first place. A third touch is generally considered the first real trade signal, since it’s the first time price has come back to test a line built from two prior points. Each touch after that adds more confidence, up to a point. Very old trendlines with many touches can eventually run out of room simply because the trend has been going for a long time.
What’s the difference between a trendline and a channel?
A channel adds a second, parallel line on the opposite side of price, creating a zone rather than a single line. Everything covered here about drawing valid trendlines applies to each side of a channel individually.
Can a broken trendline become valid again?
Sometimes. If a trendline is only broken slightly and price comes back to respect it again shortly after, some traders keep the original line active and treat the small break as noise rather than a real reversal. This depends heavily on how far price moved past the line relative to the timeframe you’re trading, so treat it as a judgment call rather than a hard rule while you’re still learning.
What’s the difference between trading a trendline bounce and a trendline breakout?
A bounce trade assumes the trendline will hold and enters in the direction the trend is already moving. A breakout trade assumes the trendline is about to fail and enters in the new direction once a candle closes clearly past it. Both are valid, but they’re opposite bets on the same line, so it’s worth deciding which one you’re taking before you place an order, not after.
Is trendline trading better on a day trading or swing trading timeframe?
Neither is objectively better. Shorter timeframes like the 5-minute or 15-minute chart suit day traders who can watch price closely and need tighter stops, while daily or weekly charts suit swing traders checking in once or twice a day with fewer, more reliable setups and wider stops. Match the timeframe to how much time you can actually dedicate to watching the trade, not the other way around.
Do professional traders still use trendlines, or is it outdated?
It’s still widely used, including alongside more advanced tools. The technique is old precisely because the underlying behavior, price reacting at levels where it’s reacted before, hasn’t changed. What’s changed is charting software making it faster to draw and adjust lines, not the concept itself.
What’s a realistic win rate for trendline trading?
There’s no fixed number, and any specific percentage quoted without context (a particular market, timeframe, and set of rules tested over a large sample) isn’t meaningful. Focus on risk-to-reward and consistent rule-following instead of chasing a win rate figure.
Common mistakes that ruin a trendline setup
Drawing through price, not around it. A valid trendline shouldn’t cut through the middle of candlesticks between your two anchor points. If your line slices through wicks and bodies along the way, it’s not marking a real level of support or resistance. Redraw it using cleaner touch points.
Keeping a trendline that’s clearly broken. If price closes significantly beyond a trendline, that trendline is done. Draw a new one based on the fresh high or low that forms instead of forcing the old line to keep working.
Chasing a setup hours after it happened. This is probably the single most common mistake. A trader spots a great bounce off a trendline that already played out, jumps in late anyway, and ends up with a poor entry price and a stop loss that’s much wider than it should be. If you missed the setup, wait for the next one. There’s always a next one.
Entering at the wrong touch point. You need at least two points to draw a trendline in the first place. The next time price comes back and touches that line is a valid signal. Entering at some other spot on the chart that never actually touched the trendline isn’t a trendline trade. It’s a guess wearing a trendline’s clothes.
Ignoring candle size at the entry point. An unusually long candle forming right at your entry area usually means the stop loss distance balloons and your entry ends up far from the trendline itself. When you see this happen, it’s often better to skip the trade, or scale down your position size significantly if you decide to take it anyway.

Putting it together
None of this requires an indicator, a paid signal service, or a complicated system. It requires a chart, a way to draw a line, and the discipline to wait for price to actually touch that line before acting.
Start small. Pick two or three stocks or ETFs you already follow. Go back through their charts and practice drawing trendlines on past price action. See how often price respected the lines you drew, and how often it didn’t. That single exercise, repeated over a few weekends, will teach you more about reading a chart than most paid courses will.
Once you’ve got a feel for it, apply the entry and stop loss rules above on a small position size, or in a paper trading account first, until the process feels automatic. Trendline trading rewards patience over speed. The setups you skip because they don’t meet your rules matter just as much as the ones you take.
1 thought on “Trendline Trading Strategy: How to Draw and Trade Trendlines Like a Pro”