
Chart reading patterns get taught the same shallow way in almost every beginner resource: here’s a picture of a double top, here’s a picture of a head and shoulders, good luck. What rarely gets explained is why these patterns work, what happens when they fail, and the handful of lesser-known formations that separate someone who recognizes shapes from someone who actually reads what a chart is telling them.
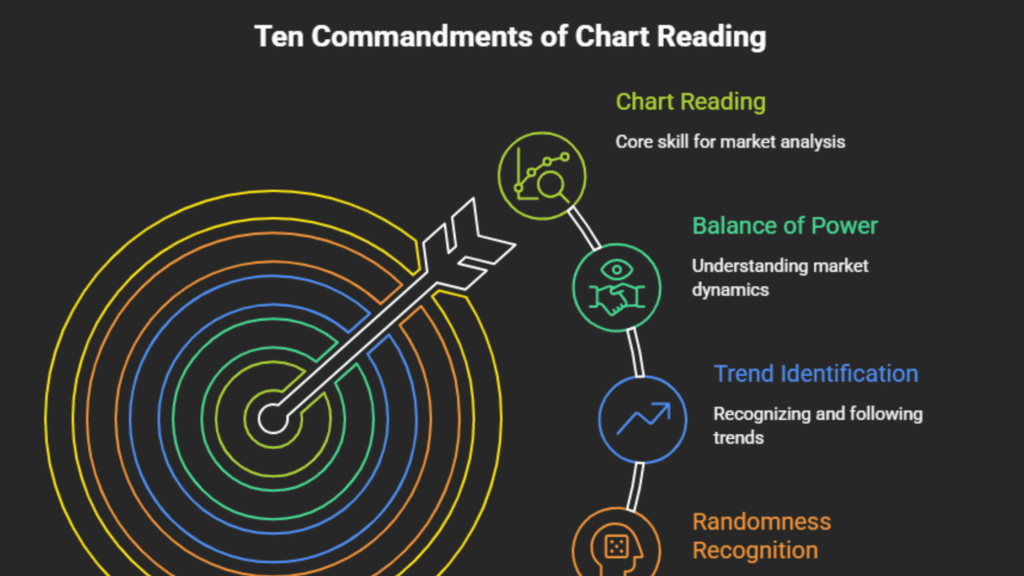
This guide covers the reversal pattern that almost nobody teaches properly (the 1-2-3), the pattern most frequently confused with a false breakout (the Wyckoff Up Thrust), the projection tool that tells you where price is likely going before it gets there (the Measured Move), and the probabilistic mindset that ties all of it together. He Ten Commandments of Chart Reading
Before any specific pattern, it’s worth internalizing the mindset that makes pattern recognition actually useful rather than just decorative.
You shall know the specifications of the symbols you are reading. Before analyzing any chart, understand exactly what instrument, time frame, and session you’re looking at.
You shall not decorate your charts with indicators until you understand the principles of chart reading. Indicators layered on top of a misunderstood chart just add noise to confusion.
You shall use chart reading to determine the balance of power among market participants, not merely to draw lines.
You shall not be fooled by randomness. Prices go up. Prices go down. Sometimes there really is no discernible meaning behind a particular move — and recognizing when a chart is not saying anything meaningful is as valuable as recognizing when it is.
You shall remember the trend is your friend until it ends — and know how to determine when it has actually ended, rather than guessing.
You shall not get lost in the ticks. Always keep the bigger structural picture in mind rather than reacting to every small wiggle.
You shall know when to step away from the charts and clear your head.
These aren’t decorative rules. They’re the difference between a trader who reacts to every candle and a trader who reads structure.
Trading With a Probabilistic Mindset
Chart patterns don’t guarantee outcomes. They shift probabilities. A completed pattern means the odds favor one outcome over another — not that the outcome is certain.
This distinction matters enormously for how you manage risk. If a pattern implies, say, a 65% chance of continuing in the expected direction, that also means roughly a third of the time it won’t. Trading a pattern with a probabilistic mindset means you accept losing trades as a normal, expected part of a positive-odds process, rather than treating every loss as evidence the method is broken.
The goal of studying chart patterns isn’t to find a formation that’s “always right.” It’s to identify setups where the historical odds are meaningfully skewed in your favor, then manage size and risk so that being wrong some of the time doesn’t threaten your account.
The 1-2-3 Pattern: The Foundation of Trend Reversal
Most traders have heard of double tops and head-and-shoulders patterns. Far fewer understand the 1-2-3 pattern, even though it’s arguably the cleanest, most objectively defined reversal structure available — and it frequently forms the hidden mechanism behind those more famous patterns.
How a 1-2-3 Sell Forms
The pattern has 3 legs. The first leg is a strong move that takes out a recent swing low in one decisive push — this leg must be at least as strong as the prior upswing for the pattern to carry real weight. The second leg is a corrective bounce back up. The third leg pushes back down.
A horizontal trigger line gets drawn at the level where the second leg (the bounce) began. The pattern is confirmed and triggered the moment the third leg’s price action breaks below that trigger line. Once triggered, the end of the second leg typically acts as resistance going forward.
A 1-2-3 Buy is the mirror image: a strong first leg that takes out a recent swing high, a corrective pullback down, then a third leg that pushes back up through the trigger line.
Table 1: 1-2-3 Pattern — Bullish vs Bearish
| Element | 1-2-3 Sell (bearish) | 1-2-3 Buy (bullish) |
|---|---|---|
| First leg | Strong break below a prior swing low | Strong break above a prior swing high |
| Second leg | Corrective bounce upward | Corrective pullback downward |
| Third leg | Push back down through the trigger line | Push back up through the trigger line |
| Confirmation | Price closes below the trigger line | Price closes above the trigger line |
| Result | Downtrend likely to continue | Uptrend likely to continue |
When a 1-2-3 Fails
The pattern doesn’t always work, and understanding exactly how it fails prevents a specific, expensive mistake.
If a 1-2-3 Sell forms after an explosive up move and then fails to continue lower, here’s what’s actually happening: traders who went short at the pattern’s trigger are now trapped in losing positions as price rallies back up. To escape, they have to buy back their short positions. That forced buying from trapped shorts becomes new demand, which can turn what looked like an impending reversal into a powerful continuation of the original uptrend instead.
The practical lesson: don’t add to a losing 1-2-3 position hoping the pattern will eventually work out. If price fails to continue in the triggered direction, that failure itself is information — it usually means the pattern has flipped into fueling the opposite move.
The Mini 1-2-3: Spotting Reversals Before They Fully Form
Many larger reversal patterns on higher time frames actually begin as a small 1-2-3 formation visible only on a much lower time frame. A Double Bottom forming on the hourly chart, for instance, often starts with a tiny 1-2-3 Buy visible only on the 15-minute chart at the second bottom.
This creates a kind of waterfall effect: the shorter time frame reversal shocks the market, catching longer time frame participants off guard and triggering their stop orders, which then fuels the larger pattern’s completion. Watching for a mini 1-2-3 on a lower time frame lets you anticipate a larger pattern’s development before it fully completes on the higher time frame — entering earlier, with the trade-off of somewhat lower initial confirmation.
Early Entry vs Waiting for Confirmation
There’s a genuine trade-off built into how you use this pattern. Entering early, at the first signs of formation before the trigger line is crossed, gets you a better price and bigger potential profit — but the statistics of the pattern’s success don’t fully apply yet, since it isn’t complete. Waiting for full confirmation (price actually crossing the trigger line) gives you the benefit of the pattern’s full statistical odds, but your entry price is further from the actual start of the move.
Neither approach is wrong. What matters is deciding your exit plan before entering, based on your own risk tolerance, and then not deviating from it once you’re in the trade.
Wyckoff Up Thrust: The Pattern Constantly Confused With a False Breakout
This is one of the most misunderstood formations in technical analysis, largely because most sources copy its definition without verifying the details that actually make it work.
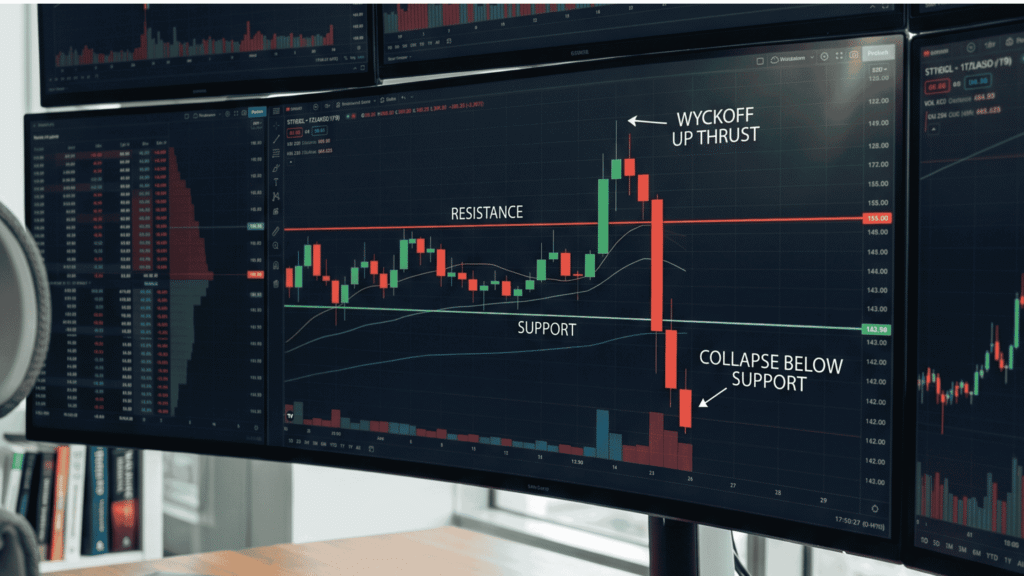
A Wyckoff Up Thrust marks the end of an uptrend, but it has 3 specific characteristics that distinguish it from an ordinary false breakout.
Table 2: The 3 Characteristics of a Valid Wyckoff Up Thrust
| Characteristic | What It Requires |
|---|---|
| 1. Virgin swing high | The top being tested must not have been challenged multiple times before — unlike a false breakout, which can occur at a resistance level already tested many times |
| 2. Marginal breach that fails | Price must breach the original top but fail to hold above it — struggling above and below the level rather than rallying cleanly higher |
| 3. Breakdown below prior support | Price must then fall below the support level between the original top and the retest |
The detail most analysts miss: the retest of the original top must itself occur within a 1-2-3 Sell formation to trigger the breakdown. Without this specific element, what looks like a Wyckoff Up Thrust is really just an ordinary false breakout — and the two have very different implied targets.
A false breakout’s projected downside target is simply the previous support level, with no statistical basis for assuming a longer-term trend change. A confirmed Wyckoff Up Thrust implies something considerably bigger: the market likely won’t challenge that original top again for at least as long as the time it spent between the two tops, and it’s likely to print a new lower low. That’s the beginning of a genuine trend change, not just a failed breakout.
Why this distinction matters practically: treating a Wyckoff Up Thrust as a simple false breakout means you’ll likely take profit far too early, missing the much larger move the pattern actually implies. Recognizing the full 3-characteristic setup lets you hold for a target that reflects the pattern’s true statistical weight.
The Measured Move: Projecting Where Price Is Likely Going
A Measured Move (also called a 1-to-1 swing or ABCD move) is one of the most structurally reliable projection tools available, precisely because markets sometimes move in genuinely well-organized, repeatable ways.
The pattern consists of 2 swings in the same direction, separated by a pause or consolidation. For the pattern to hold real predictive value, the 2 swings need to be similar to each other — comparable in both the time spent and the price distance traveled.
The critical rule: a Measured Move only has value if you project it before it completes, not after. Labeling 2 swings as a “Measured Move” retroactively, once price has already arrived at the target, tells you nothing useful. The entire value of the tool is using the first swing’s characteristics to estimate where the second swing is likely to end, while there’s still time to position for it.
Table 3: How to Use a Measured Move
| Step | Action |
|---|---|
| 1. Identify the first swing | Measure its price distance and duration |
| 2. Watch for the consolidation | A pause or sideways structure following the first swing |
| 3. Project the second swing | Apply the same price distance from the consolidation’s breakout point |
| 4. Set your target | The projected level becomes a realistic profit target |
This tool pairs especially well with continuation patterns like bull flags and bear flags. A bear flag — a period of higher lows and higher highs within an overall downtrend, essentially a corrective pause — typically produces a Measured Move once it breaks down, especially when the market isn’t already close to a significant support level. The initial down-leg becomes the template for projecting how far the next leg is likely to travel once the flag breaks.
Bear Flags and Bull Flags: The Most Common Continuation Pattern
Flags appear across every time frame and every market, which makes them worth understanding properly rather than just recognizing on sight.
A bear flag is a continuation pattern during a downtrend: after a strong down move, price consolidates in a pattern of higher lows and higher highs, essentially drifting upward in a controlled, narrowing range. This can look deceptively like a bottom forming. The pattern completes when price breaks down beneath the last higher low.
A bull flag is the mirror image during an uptrend.
How to trade a bear flag: sell the break of the rising lower support line that defines the flag’s boundary. This gives controlled risk and a clear invalidation point if the breakdown doesn’t materialize.
The mistake to avoid: don’t short into an upward spike within what you believe is a bear flag. Sometimes what looks like a bear flag is actually the early stage of a rounding bottom or an inverse head and shoulders — patterns that imply the exact opposite outcome. Wait for the actual breakdown before committing.
Double Top: Why It’s So Hard to Trade Even When You Recognize It
A Double Top is a classic pattern: 2 swing tops stopping at nearly the same price level (the “neckline area”), with the low point between them called the neckline. Once price breaks decisively below the neckline, that level typically flips to become resistance, and a downside target roughly equal to the height of the formation comes into play. If the break happens quickly, the resulting drop can sometimes extend to twice that height before a meaningful bounce.
Table 4: Double Top Trading Considerations
| Consideration | Detail |
|---|---|
| Formation complete when | Price breaks below and stays below the neckline |
| Typical downside target | Height of the double top formation, projected down from the neckline |
| Extended target scenario | Up to 2x the formation height if the break is fast and decisive |
| Common trap | A 1-2-3 Sell pattern often forms right at the neckline break |
Why traders struggle to actually sell this pattern in practice: by the time it triggers, the move already feels like it’s “missed” a significant part of the decline. That psychological discomfort causes many traders to buy the trigger point instead of selling it, expecting a bottom — putting them on the wrong side of the move entirely. Recognizing this tendency in yourself is often more valuable than recognizing the pattern itself.
Multiple Time Frames: Building Real Context
No single time frame tells the whole story. A pattern that looks like a clean reversal on a 5-minute chart might be nothing more than a minor pullback within a much larger uptrend on the daily chart.
The money-management time frame is the practical concept of choosing the time frame your actual trade decisions are based on, while still checking higher time frames for broader context and lower time frames for precise entry timing. A swing trader working primarily off daily charts still benefits from checking the weekly chart for major structural context, and the 1-hour or 15-minute chart for entry precision.
The bootstrapping technique: use a shorter time frame’s completed pattern (like a mini 1-2-3) to anticipate and enter ahead of a larger pattern’s completion on a higher time frame, exactly as described earlier in the mini 1-2-3 section. This is one of the most practical ways multiple time frame analysis pays off directly in trade execution.
Bringing It Together: A Practical Reading Sequence
- Establish context — check the higher time frame for overall trend direction and any major support/resistance levels
- Identify swing structure — locate genuine swing highs and swing lows using a consistent method
- Watch for 1-2-3 formations — both on your main time frame and as mini versions on lower time frames that may signal an earlier entry
- Distinguish false breakouts from Wyckoff Up Thrusts — check for the 3 specific characteristics before assuming a bigger trend change is underway
- Look for Measured Move setups — project targets from flag consolidations and other structured 2-swing formations before they complete, not after
- Trade with a probabilistic mindset — accept that even well-formed patterns fail a meaningful percentage of the time, and size your risk so that failure rate doesn’t threaten your account
- Know when to step back — if you can no longer read what the chart is likely to do next, that’s the signal to close the position rather than hold and hope
[IMAGE PLACEHOLDER: Photorealistic DSLR editorial photo of a trading desk with a large monitor showing a stock chart with a clearly marked 1-2-3 reversal pattern, colored trend lines visible in red, blue, and orange matching the classic 1-2-3 labeling convention. Clean professional setup. Canon EOS R5, 50mm f/1.8, ultra sharp, 8K, no AI glow, no illustration.]
File name: chart-reading-patterns-1-2-3-wyckoff-measured-move.webp Alt text: Chart reading patterns — 1-2-3 reversal pattern marked in red blue and orange trend lines on trading monitor Placement: Below “The 1-2-3 Pattern” section, above “Wyckoff Up Thrust”
Frequently Asked Questions
What is the 1-2-3 pattern in trading?
The 1-2-3 pattern is a 3-leg reversal formation. The first leg breaks a prior swing high or low with strength, the second leg is a corrective retracement, and the third leg pushes back through a trigger line drawn at the level where the second leg began. Confirmation occurs when price closes beyond that trigger line, at which point the pattern implies the new direction is likely to continue.
What is a Wyckoff Up Thrust and how is it different from a false breakout?
A Wyckoff Up Thrust requires 3 specific characteristics: the top being tested must be a virgin swing high (not previously challenged multiple times), the retest must breach the top but fail to hold above it, and price must then break down below the support level between the two tops. Without the retest occurring within a confirmed 1-2-3 Sell formation, what looks like a Wyckoff Up Thrust is actually just an ordinary false breakout with a much smaller implied target.
What is a Measured Move in chart reading?
A Measured Move consists of 2 similar swings in the same direction separated by a consolidation pause. The pattern is used to project where price is likely to go by applying the first swing’s price distance and duration to estimate the second swing’s target — but only has predictive value when identified before it completes, not labeled retroactively after the fact.
Why do 1-2-3 patterns sometimes fail?
A 1-2-3 pattern can fail when traders who entered on the trigger become trapped in a losing position as price reverses again. Their forced buying (if they were short) or selling (if they were long) to exit adds fuel to a continuation of the original trend rather than the expected reversal. This is more common after explosive prior moves that leave many traders on the wrong side of the market.
What is a bear flag and how do you trade it?
A bear flag is a continuation pattern during a downtrend, where price consolidates in a series of higher lows and higher highs before breaking back down. It’s traded by selling the break of the rising lower support line that defines the flag. A common mistake is shorting an upward spike within the flag before the actual breakdown, since that spike can sometimes indicate a different pattern entirely, like a rounding bottom.
Why is trading with a probabilistic mindset important?
Chart patterns shift the odds in a trader’s favor; they don’t guarantee outcomes. A pattern with historically favorable odds will still fail a meaningful percentage of the time. Trading with a probabilistic mindset means accepting losing trades as a normal part of a positive-odds process and managing position size so that expected losses don’t threaten the overall account, rather than treating each individual loss as proof the method doesn’t work.
About the Author — Jamaluddin K.A.
Jamaluddin is the founder of The First Time Investor, a US and UK-focused personal finance and investing education site. He covers chart reading, market structure, and price action concepts for traders who want to move beyond surface-level pattern recognition.
Disclosure: This article is for educational purposes only and does not constitute financial advice. Trading involves significant risk including the potential loss of principal. Consult a licensed financial advisor before making investment decisions.