
How to value a stock is the single most important skill in investing and the one most people skip entirely.
Most retail investors buy stocks because they read something positive, heard a tip, or watched a chart move upward. They have no idea what the business is actually worth. And without knowing what something is worth, there is no way to know whether you’re getting a bargain or paying too much.
This guide builds the full framework, step by step. Real numbers. Real examples. No jargon left unexplained.
What a Stock Is Actually Worth
Before any formula, before any ratio, the foundation matters.
The value of any asset is the sum of all the cash flows it produces over its useful life, discounted for the time value of money and the uncertainty of receiving those cash flows.
That’s it. Everything else in stock valuation is a shortcut back to that definition.
The phrase has 3 distinct parts:
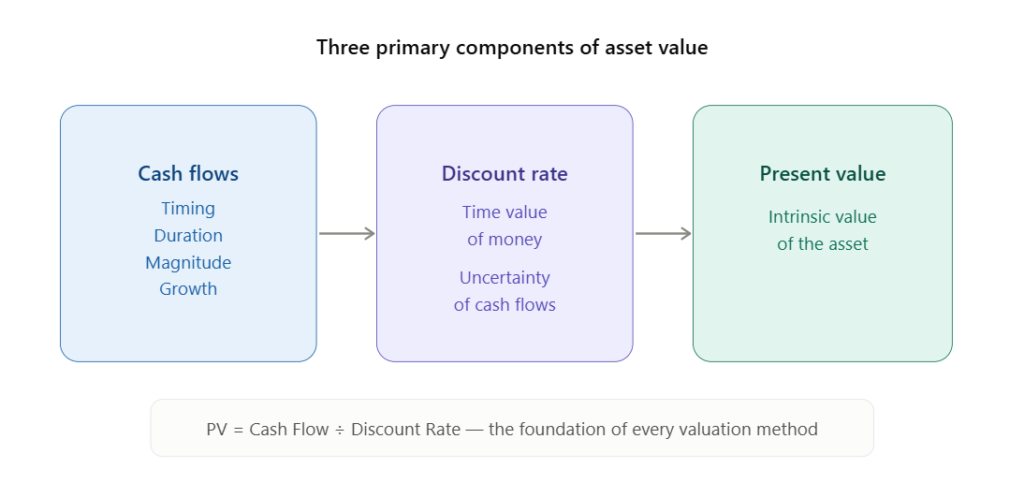
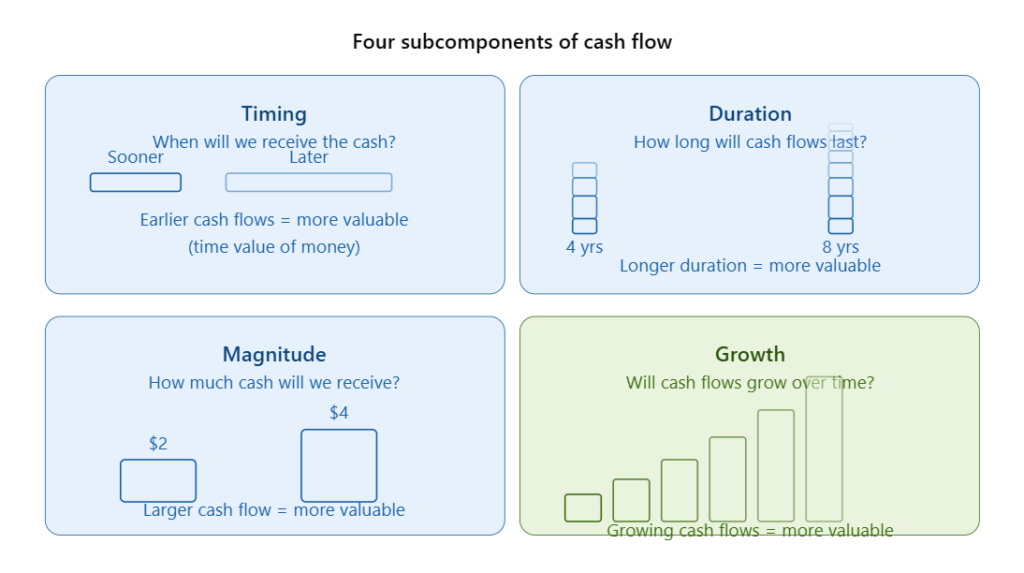
Cash flows produced over its useful life. Not earnings. Not EBITDA. Not revenue. Cash that actually leaves the business and reaches the owner. Cash flows have 4 subcomponents:
- Timing: Getting cash sooner is better than getting it later. A business paying you $1,000 today is worth more than one paying you $1,000 in 5 years.
- Duration: How long will the cash flows last? A business running for 20 years is more valuable than one running for 5.
- Magnitude: How much cash? Larger is obviously better than smaller.
- Growth: Is the cash flow growing over time? Growing cash flows are more valuable than flat ones. Flat cash flows are more valuable than declining ones.
Discounted for the time value of money. A dollar today is worth more than a dollar tomorrow. This is not a finance technicality. It is a basic economic reality. If someone offers to pay you $100 today or $100 in 3 years, you take the $100 today and invest it. That’s the time value of money at work.
Discounted for uncertainty. Future cash flows are estimates, not guarantees. A US Treasury bond payment next year is highly certain. A start-up’s projected revenue in year 5 is not. The more uncertain the cash flow, the more you discount it. This is how risk enters the valuation.
Why Every Valuation Method Is a DCF in Disguise
Here’s the thing most investors never realize.
When a portfolio manager says “This stock is cheap at 12x earnings,” they are performing a discounted cash flow analysis. When an analyst says “We value the company at 8x EBITDA,” they are performing a DCF. When someone says “The company trades at a 30% discount to private market value,” that’s a DCF.
Every valuation multiple, every ratio, every comparable transaction analysis is a shortcut to the same underlying calculation: the present value of future cash flows.
The formula for the present value of a perpetuity (a stream of cash flows that lasts forever) is:
PV = Cash Flow / Discount Rate
A P/E ratio is just the inverse of this. If a stock has earnings of $8.66 per share and trades at $117.16, the earnings yield is 7.4% ($8.66 / $117.16). That’s the discount rate implied by the market. The P/E ratio is just expressing the same relationship from the other direction.
This is why all valuation methods, P/E ratios, EBITDA multiples, price-to-sales, liquidation value, private market value, are derivatives of the DCF model. Whether investors acknowledge it or not, they are always estimating the present value of future cash flows.
The Lemonade Stand That Explains Everything
One of the clearest ways to understand stock valuation is to start with a business simple enough to model completely.
Consider a lemonade stand. Real assets, real costs, real cash flows. Let’s build the income statement.
Table 1: Income Statement for a Simple Business (Annual)
| Line Item | Year 1 | Year 2 | Year 3 | Year 4 |
|---|---|---|---|---|
| Revenues | $1,200 | $1,200 | $1,200 | $1,200 |
| Cost of Goods Sold | -$540 | -$540 | -$540 | -$540 |
| Gross Profit | $660 | $660 | $660 | $660 |
| Selling, General & Admin | -$492 | -$492 | -$492 | -$492 |
| Operating Income | $168 | $168 | $168 | $168 |
| Income Taxes | -$59 | -$59 | -$59 | -$59 |
| Net Income | $109 | $109 | $109 | $109 |
| Depreciation & Amortization | $63 | $63 | $63 | $63 |
| Maintenance Capex | -$52 | -$52 | -$52 | -$52 |
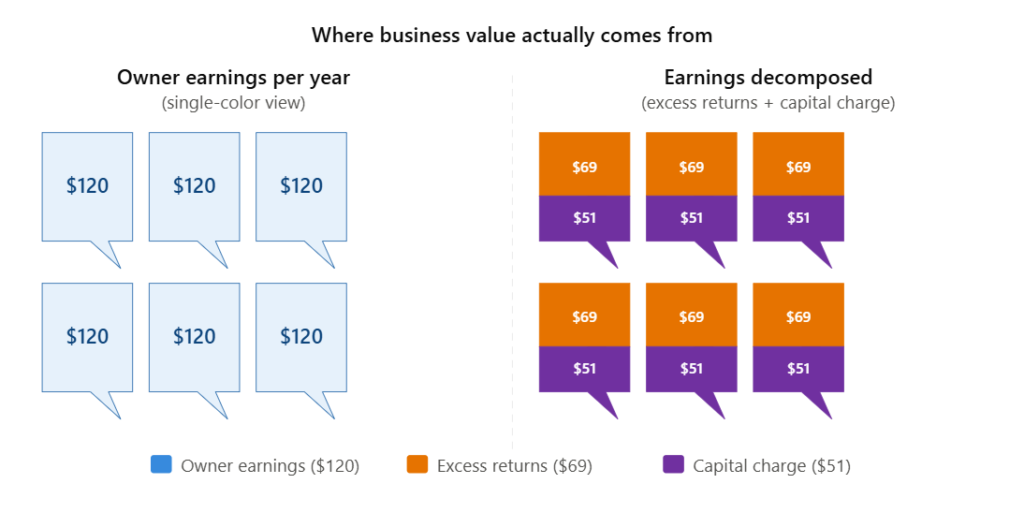
| Owner Earnings | $120 | $120 | $120 | $120 |
Note that “owner earnings” (Net Income + Depreciation – Maintenance Capex) is $120 annually, not EBITDA.
Why EBITDA Misleads Investors
EBITDA (Earnings Before Interest, Taxes, Depreciation, and Amortization) has become the dominant financial metric on Wall Street. It’s also a deeply flawed measure of what a business is actually worth.
Table 2: Owner Earnings vs EBITDA — The Hidden Gap
| Owner Earnings | EBITDA | |
|---|---|---|
| Revenues | $1,200 | $1,200 |
| Cost of Goods Sold | -$540 | -$540 |
| Gross Profit | $660 | $660 |
| Selling, General & Admin | -$492 | -$492 |
| Operating Income | $168 | $168 |
| Income Taxes | -$59 | — |
| Net Income | $109 | — |
| Depreciation & Amortization | $63 | $63 |
| Maintenance Capex | -$52 | — |
| Result | $120 | $231 |
EBITDA shows $231 in apparent “cash flow.” Owner earnings shows $120. The $111 gap is real money that the business must spend: tax obligations, maintenance capital expenditures to keep the assets from falling apart, and interest on any debt. EBITDA ignores all of it.
The lemonade stand will physically deteriorate without maintenance spending. Skip the taxes and the government comes knocking. Ignore interest and the lender takes the assets.
Owner earnings is the cash the business actually produces that the owner can take home with no harm to future operations. That’s the number that matters for valuation.
How to Calculate What a Business Is Actually Worth (Discounted Cash Flow)
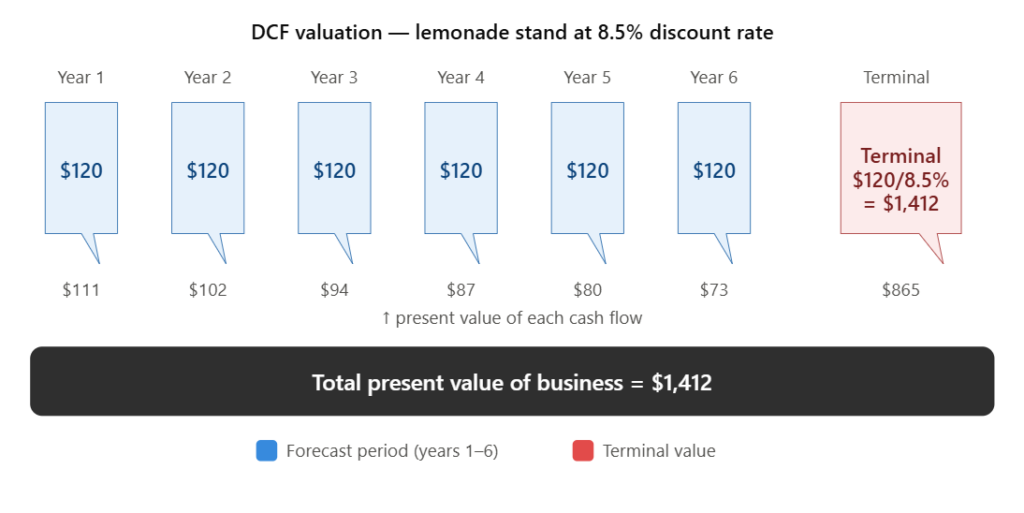
With $120 in annual owner earnings, let’s calculate the present value of the business.
Using 8.5% as the discount rate (capturing both the time value of money and the uncertainty of the business), the basic perpetuity formula gives:
PV = $120 / 8.5% = $1,412
That’s the base value of the business assuming it generates $120 annually, grows at a steady rate in the long run, and keeps operating indefinitely.
But what if the business grows? Growth changes the valuation significantly.
Table 3: How Growth Rate Changes Business Valuation
| Growth Rate (Years 1-6) | PV of Forecast Period | PV of Terminal Value | Total Value |
|---|---|---|---|
| 0% | $547 | $865 | $1,412 |
| 10% | $687 | $1,394 | $2,081 |
| 15% | $772 | $1,739 | $2,511 |
The business with 15% growth is worth 78% more than the same business with no growth — $2,511 vs $1,412.
This is why investors pay high multiples for fast-growing companies. They’re not irrationally optimistic. They’re calculating the present value of faster-growing future cash flows, which is genuinely higher.
The Discount Rate: What Rate Should You Use?
The discount rate is meant to capture the cost of capital, which is the rate of return investors demand to make an investment.
The academically approved method is the Weighted Average Cost of Capital (WACC):
WACC = (Debt / Total Capital) × (Cost of Debt) + (Equity / Total Capital) × (Cost of Equity)
The cost of debt is straightforward: look at the interest rate on the company’s existing bonds or loans.
The cost of equity is trickier. Most finance textbooks use the Capital Asset Pricing Model (CAPM):
Cost of Equity = Risk-Free Rate + Beta × (Market Return – Risk-Free Rate)
Table 4: WACC Calculation Example (Specialty Chemical Company, 2016)
| Component | Value |
|---|---|
| Total Debt | $532 million |
| Total Equity (market value) | $2,000 million |
| Interest Rate on Debt | 5.93% (senior) / 3.78% (term loan) |
| After-Tax Cost of Debt | 3.6% |
| Risk-Free Rate (10yr Treasury) | 2.2% |
| Beta | 1.2 |
| Expected Market Return (S&P 500) | 9.7% |
| Cost of Equity | 11.2% |
| WACC | ~9.6% |
Notice that after all the math, the WACC came out to 9.6% — essentially the same as the S&P 500’s long-term historical return of 9.7%.
This is why Warren Buffett and Charlie Munger dismiss complex cost of capital calculations. As Munger said at Berkshire’s 2003 annual meeting, “Intelligent people make decisions based on opportunity costs — in other words, it’s your alternatives that matter.”
The practical takeaway: use 10% as your discount rate. It’s a reasonable approximation of investor opportunity cost, makes the math clean, and can always be adjusted up or down as you learn more about the specific business.
What Competitive Advantage Does to a Stock’s Value
Here’s the concept that separates great investments from mediocre ones — and that most investors completely underestimate.
A business earns excess returns when its return on invested capital (ROIC) exceeds its cost of capital (WACC). Those excess returns are what attract competition. And competition is what erodes them.
Return on Invested Capital (ROIC) = Owner Earnings / Invested Capital
For the lemonade stand:
ROIC = $120 / $600 = 20.0%
With a cost of capital of 8.5%, the excess return is 11.5%, or $69 per year in dollar terms.
Table 5: How Competitive Advantage Breaks Down Business Value
| Component | Calculation | Value |
|---|---|---|
| Present Value of Excess Returns | $69 / 8.5% perpetuity + terminal value | $812 |
| Present Value of Capital Charge | $51 / 8.5% perpetuity + terminal value | $600 |
| Total Business Value | $1,412 |
The invested capital itself is worth $600. The competitive advantage that generates those excess returns is worth another $812. Together they equal the business’s total value.
Now watch what happens if the ROIC equals the cost of capital (no competitive advantage):
Total Value = $0 (excess returns) + $600 (invested capital) = $600
The business is only worth what you put into it. No competitive advantage means no premium over invested capital.
And if ROIC falls below the cost of capital:
Total Value = Less than $600
The business is worth less than the cash invested to create it. This is how value gets destroyed — not through losses, but through earning returns below the cost of capital.
This framework changes how you should think about growth. Not all growth is valuable.
Good Growth vs Bad Growth: The Concept Most Investors Miss
Most investors assume that a growing company is more valuable than a flat one. That’s only true if growth earns returns above the cost of capital.
Table 6: What Happens When a Business Grows at the Cost of Capital (8.5%)
| Growth Rate | ROIC | Additional Investment | Additional Earnings | Value Created |
|---|---|---|---|---|
| 0% | 20% | $0 | $0 | $0 |
| 10% (above WACC) | 20% | $60 | $12 | Positive |
| 10% (equal to WACC) | 8.5% | $60 | $5.10 | $0 |
| 10% (below WACC) | 5% | $60 | $3 | Negative |
When a company grows by reinvesting capital at a rate equal to its cost of capital (8.5% in our example), the growth creates zero additional value. The new earnings just offset the new capital charge. The business is worth the same whether it grows at 10% or doesn’t grow at all — as long as the ROIC equals the cost of capital.
Growth only adds value when ROIC exceeds WACC. Growth actually destroys value when ROIC falls below WACC.
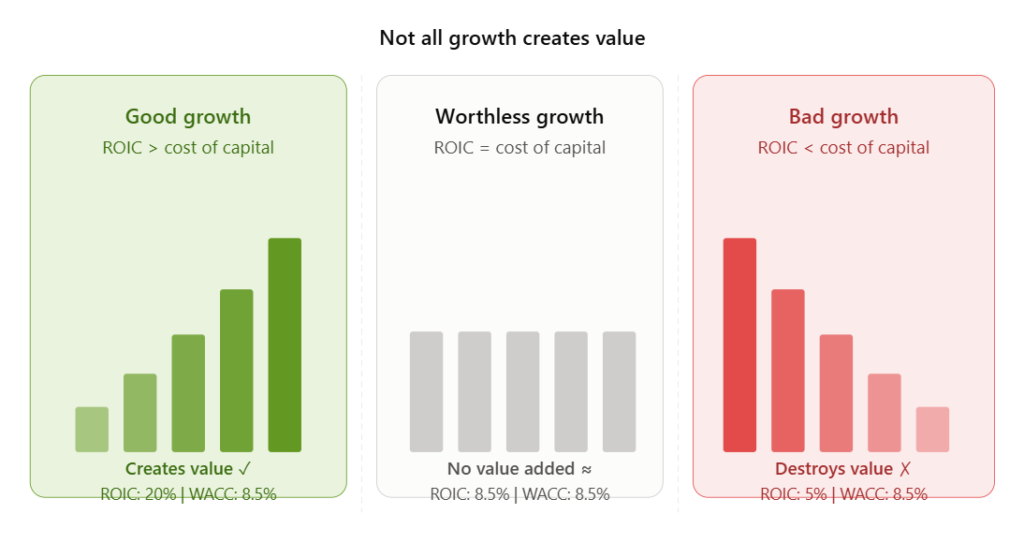
This is the insight most financial media gets completely wrong. “Fast growth” is not synonymous with “value creation.” The question is always whether growth generates returns above the cost of capital.
Sources of Competitive Advantage: Where Excess Returns Come From
Since excess returns are what drive most of a stock’s value beyond its invested capital, understanding what creates and sustains them is critical.
Companies generate excess returns through 3 mechanisms: charging higher prices, achieving lower costs, or using capital more efficiently.
Table 7: Three Ways Competitive Advantage Shows Up in the Numbers
| Advantage Type | Mechanism | Example Effect on ROIC |
|---|---|---|
| Price advantage | Customer pays more than competitors charge | ROIC 15% vs competitor 10% |
| Cost advantage | Lower costs at same price | ROIC 25% vs competitor 10% |
| Capital efficiency | Same returns with less invested capital | ROIC 20.3% vs competitor 10% |
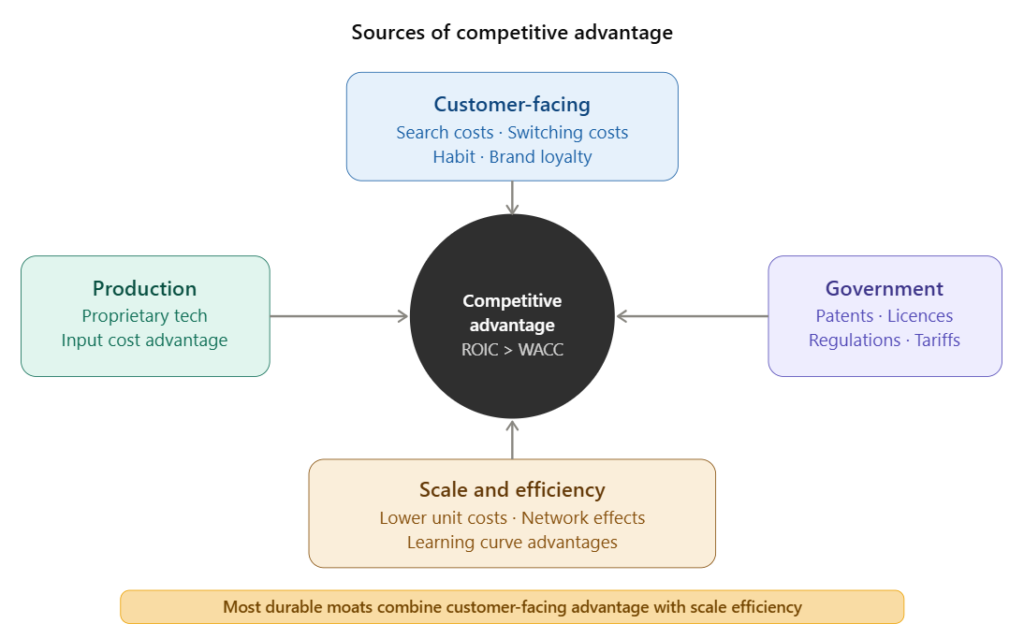
Those advantages come from 4 underlying sources:
1. Customer-facing advantages. When customers are captive: through search costs (don’t want to comparison shop), switching costs (too costly or time-consuming to switch), or ingrained habit. Tylenol commands a 50% price premium over generic acetaminophen because the brand reinforces the buying habit.
2. Production advantages. Lower costs of manufacturing from proprietary technology, unique input resources, or superior distribution networks.
3. Scale advantages. Fixed costs spread over more units reduce cost per unit. Coca-Cola’s advertising budget is spread across billions of bottles. A new entrant’s same budget covers far fewer units, creating a structural cost disadvantage.
4. Government policy. Patents, regulations, licenses, and tariffs can create temporary moats. These are the most fragile, as they can change overnight.
The most durable competitive advantages combine a customer-facing moat with a scale-based cost advantage. The customer captivity makes it hard to steal customers; the scale makes it hard to undercut on price. Together, they can sustain excess returns for decades.
Intrinsic Value Is a Range, Not a Number
Here’s where most valuation analysis goes wrong.
Most analysts calculate intrinsic value and report it as a single precise number: “Our 12-month price target is $48.72.” That precision is an illusion.
The future is inherently uncertain. Cash flows in year 3 could come in high, on target, or below expectations. Cash flows in year 7 are even harder to predict. The further out you forecast, the wider the reasonable range of outcomes.
Table 8: How Uncertainty Widens the Distribution of Possible Values
| Time Horizon | Certainty of Cash Flow Estimate | Distribution of Outcomes |
|---|---|---|
| Year 1 | Relatively high | Narrow range |
| Year 3 | Moderate | Wider range |
| Year 5 | Lower | Significantly wider |
| Year 7+ | Low | Very wide range |
Instead of thinking about intrinsic value as a single number, think of it as a distribution of possible values centered on a single-point estimate. The base case might suggest $40 per share. But the range is $28 to $55 depending on how optimistic or conservative you are on growth and competitive durability.
The practical implication: the margin of safety. If your estimate of intrinsic value is $40, with a wide range of uncertainty, paying $38 offers essentially no protection against being wrong. Paying $25 — a significant discount — gives you protection if your growth assumptions prove optimistic.
This is why value investors talk about buying dollar bills for 50 cents. The discount to intrinsic value is the protection against analytical error.
Liquidation Value and Private Market Value: The Floor
Before buying any stock, it’s worth understanding two valuation floors.
Liquidation value is what the business would generate if it stopped operating and sold all its assets today. For each asset class, apply realistic recovery rates:
| Asset | Approximate Recovery in Liquidation |
|---|---|
| Cash and marketable securities | 100% |
| Accounts receivable (strong customers) | 80-95% |
| Finished goods inventory | 70-80% |
| Work in process inventory | 30-50% |
| Equipment and machinery | 20-50% |
| Real estate | 80-100% |
| Intangibles and goodwill | 0-10% |
Subtract all liabilities. Divide by shares outstanding. That’s the liquidation value per share.
If a stock trades below its liquidation value, you’re essentially buying the assets for less than they’d sell for in a fire sale. That’s a meaningful floor.
Private market value is a more optimistic floor: what would a rational strategic or financial buyer pay to control these assets? Strategic buyers often pay above liquidation value because they believe they can generate more cash flow from the assets than the current owner. Financial buyers look for operational improvements they can implement with more management flexibility than a public company has.
When a stock trades significantly below its private market value, it becomes a takeover candidate. That’s a powerful catalyst for closing the gap between price and intrinsic value.
Precision and Accuracy: Reducing Investment Risk
Most investors focus entirely on their estimate of intrinsic value. They spend weeks building a model, calculating a target price, and checking whether the stock trades above or below it.
What they often underestimate is the timing dimension.
Investment risk has two components:
- Being wrong about intrinsic value
- Being wrong about how long it takes for the price to reach that value
A stock can be genuinely undervalued and take 5 years to correct. During those 5 years, you’ve tied up capital that could have been compounding elsewhere. The opportunity cost of waiting is real, even when you’re eventually right.
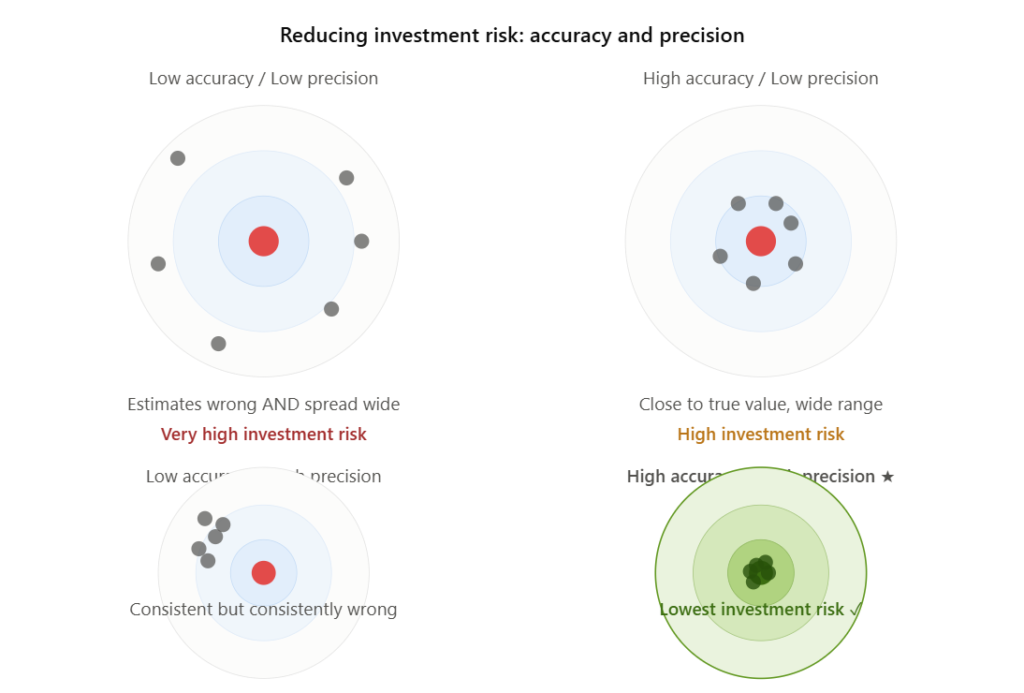
Accuracy means your estimate of value is close to the true value. Precision means your range of estimates is narrow — you’ve reduced the dispersion of outcomes through research.
The goal of research is to increase both. Every additional data point about a company’s competitive advantage, management track record, industry dynamics, and financial history helps narrow the range of possible intrinsic values and shorten the likely timeframe for the mispricing to correct.
Table 9: How Accuracy and Precision Reduce Investment Risk
| Scenario | Accuracy | Precision | Investment Risk |
|---|---|---|---|
| Estimate far from true value, wide range | Low | Low | Very high |
| Estimate close to true value, wide range | High | Low | High |
| Estimate far from true value, narrow range | Low | High | High |
| Estimate close to true value, narrow range | High | High | Low |
The bottom-right box is where you want to be: confident in your estimate and confident in your range. That combination minimizes the two most expensive mistakes in investing — overpaying and waiting too long.
What Makes a Stock Mispriced?
Finding a stock that’s cheap relative to intrinsic value is necessary but not sufficient. The deeper question is why.
If a stock is genuinely undervalued, there must be a reason other investors have missed it or misunderstood it. Markets are generally efficient. Thousands of analysts are looking at the same information. For a mispricing to exist, something specific must be happening:
An informational advantage: You know something other investors don’t have access to yet, or haven’t noticed. Legal sources only: channel checks, industry analysis, regulatory filings, deep reading of disclosed information.
An analytical advantage: You’re looking at the same data as everyone else but drawing a different conclusion. You see that the company’s mature core business is generating strong cash flows while the market is focused on a struggling new division. Everyone sees the same numbers; you interpret them differently.
A trading advantage: Other investors are unable or unwilling to hold the security. A small-cap stock falling out of an index gets sold by passive funds regardless of fundamentals. A company emerging from bankruptcy has forced sellers regardless of its new financial health. Investors face no information gap, just structural constraints that create a temporary mispricing.
The practical implication: before committing to any investment, ask explicitly: “Why is this cheap? What are other investors missing, and why am I seeing it differently?” If you can’t answer that question specifically, the stock might not be as mispriced as it appears.
A Practical Checklist Before Buying Any Stock
Before buying, run through this framework:
1. What is the business’s owner earnings? (Not net income, not EBITDA. Owner earnings.)
2. What growth rate is realistic? Based on industry dynamics, competitive position, and management track record. How long can that growth rate be sustained?
3. What is the appropriate discount rate? Start at 10%. Adjust upward for less predictable businesses, downward for highly predictable cash flows.
4. What range of intrinsic values do you get? Bear case, base case, bull case. The spread tells you how much uncertainty is in the estimate.
5. Does the stock offer a meaningful margin of safety? If the current price is at or above your base case estimate, there’s no margin. If it’s 30-40% below your base case, there is.
6. Does the company have genuine competitive advantage? Is ROIC sustainably above the cost of capital? What is the source of that advantage? How durable is it?
7. Is growth value-accretive? Does the business earn above its cost of capital on incremental growth investments, or is it growing by deploying capital at suboptimal returns?
8. Why is it mispriced? What is your variant perspective? What are other investors missing?
9. What’s the catalyst? What event or development will begin to close the gap between price and intrinsic value?
10. What’s the time horizon? How long are you willing to wait for the mispricing to correct?
Frequently Asked Questions
How do you value a stock for beginners?
Start with owner earnings: Net Income plus Depreciation minus Maintenance Capex. Divide by your required return (use 10% if uncertain). That gives you a baseline perpetuity value. Adjust upward for expected growth, downward for uncertainty. Compare that estimate to the current stock price. If the stock trades at a meaningful discount to your estimate, it may be undervalued.
What is the difference between intrinsic value and market price?
Market price is what investors are collectively willing to pay for a stock right now. Intrinsic value is your estimate of what the business is actually worth based on its future cash flows. When market price falls significantly below intrinsic value, a buying opportunity may exist. When price significantly exceeds intrinsic value, the stock may be overvalued regardless of recent momentum.
What is the best valuation method for stocks?
There is no single best method. Discounted cash flow analysis is the theoretically correct approach. Relative valuation (P/E, EV/EBITDA) is faster but depends on comparable companies being fairly valued themselves. Asset-based valuation (liquidation value, private market value) is most useful for asset-heavy businesses or potential acquisition targets. Most professional investors use multiple methods and triangulate between them.
Why do high-growth companies trade at high P/E multiples?
Because high growth, when earned at returns above the cost of capital, genuinely creates more value. A company growing at 20% and earning 25% ROIC on incremental investments is worth far more than a no-growth company earning 20% ROIC. The market is not wrong to pay a premium for it. The risk is that the growth rate slows, the ROIC declines, or both, making the high multiple unjustified.
What is a margin of safety in stock investing?
The margin of safety is the gap between your estimate of intrinsic value and the price you pay. If you estimate a stock is worth $40 and buy it at $28, your margin of safety is 30%. That gap protects you if your growth assumptions prove optimistic, if the competitive advantage is less durable than you thought, or if the mispricing takes longer to correct than expected.
How do you know if a company has a real competitive advantage?
Look at the return on invested capital over the past 10 years. If it has consistently stayed above the cost of capital (roughly 10%) through different economic cycles and competitive challenges, the company likely has a genuine competitive advantage. If ROIC varies widely year to year or trends toward the cost of capital, the advantage is either weak or eroding.
About the Author — Jamaluddin K.A.
Jamaluddin is the founder of The First Time Investor, a US and UK-focused personal finance and investing education site. He writes about stock market fundamentals, valuation principles, and investing strategies for people who want to make informed financial decisions without needing a finance degree.
Disclosure: This article is for educational purposes only and does not constitute financial advice. All investing involves risk, including the loss of principal. Consult a licensed financial advisor before making investment decisions.
2 thoughts on “How to Value a Stock: The Complete Beginner’s Guide to Finding Stocks Worth Buying”