

Most traders obsess over entries. They spend weeks hunting the perfect signal, the ideal indicator combination, the exact moment to pull the trigger. Then they pair it with a vague exit like “sell when it looks good” and wonder why their strategy falls apart in live trading.
The exit is where money actually gets made or lost. A mediocre entry with a disciplined exit will beat a brilliant entry with a sloppy one, almost every time. That’s the thing professional systematic traders figured out decades ago.
This guide covers the core entry and exits rules used in real algorithmic trading strategies the kind that get back tested, validated, and run with actual capital on the line. Whether you trade stocks, futures, or forex, these concepts apply.

What Are Trading Entry and Exit Rules (and Why Both Matter)
An entry rule tells your strategy when to open a position. A buy signal, a breakout trigger, a momentum cross. It defines the “get in” moment.
An exit rule tells your strategy when to close that position. A profit target, a time limit, a reversal signal. It defines the “get out” moment.
Together, they form a complete trading strategy. Separately, neither one does much.
Here’s what most beginner algo traders miss: a buy rule with no exit rule is still a strategy. It just happens to use a “stop and reverse” exit hidden inside the next entry signal. That’s valid, but you need to know it’s happening. The performance difference between a stop-and-reverse version and an entry-only version of the same rules can be dramatic same logic, totally different results.
Why Simple Entry and Exit Rules Outperform Complex Ones
There’s a temptation to keep adding conditions. If ADX is above 20, and RSI is below 40, and it’s not a Wednesday, and the moon is in the right phase… you get the picture.
Complex rules overfit to past data. They find patterns that existed once, in a specific period, in a specific market. Put that same strategy on live data and it collapses.
25+ years of systematic trading data supports one consistent finding: simple rules tested across many markets tend to survive. Not because markets are simple, but because overly specific rules stop working the moment conditions shift even slightly.
The practical target is 2 to 4 conditions per entry rule, maximum. If you need 10 filters to make a backtest look good, that’s a sign the edge isn’t real.
Core Entry Strategies for Algorithmic Trading
Here are the main categories of entry rules used in tested systematic strategies with enough detail to actually implement them.
Momentum-Based Entries
Momentum entries follow the direction of recent price movement. The logic: prices moving in one direction tend to keep moving in that direction, at least in the short term.
The simplest version compares the current bar’s close to the previous bar’s close. If today closes higher than yesterday, that’s a bullish momentum signal.
A more robust version adds a loss filter: if your current position has moved against you past a defined threshold, close it and reverse. This keeps you aligned with the market rather than fighting it.
Where it works best: metals markets, trend-prone futures contracts.
Watch out for: choppy, range-bound markets where momentum signals generate lots of false reversals.
Breakout Entries with Volatility Filters
A breakout entry fires when price moves to a new high or low over a defined lookback period. Buy when price breaks the highest high of the last N bars. Sell short when it breaks the lowest low.
The problem with pure breakouts: roughly 70–80% fail, depending on how you define failure. Price pokes above a high, finds no buyers, and snaps back.
Two filters dramatically improve breakout quality:
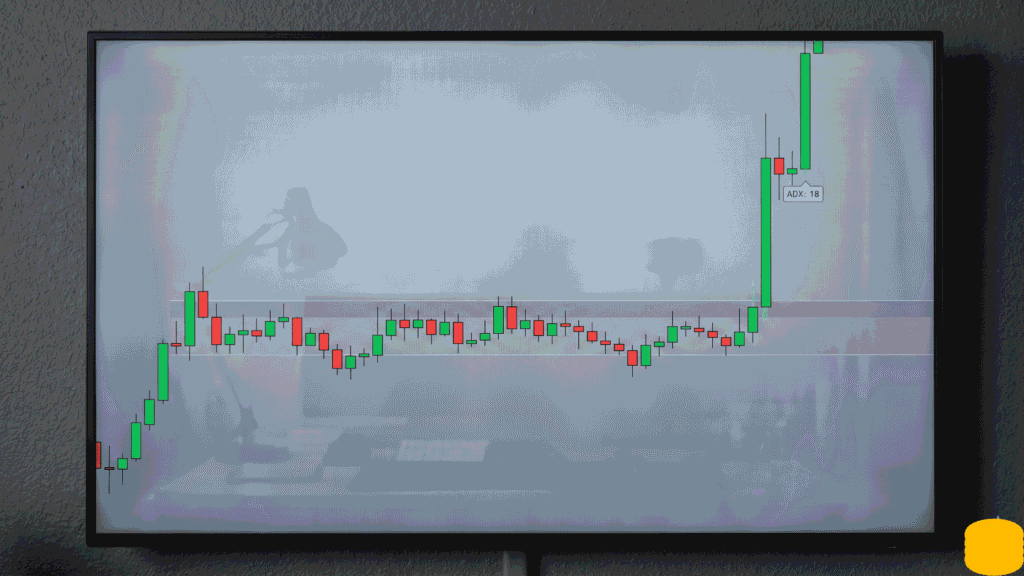
ADX filter (low ADX, enter on breakout): The ADX indicator measures trend strength. Counterintuitively, breakouts from low-ADX (non-trending, flat) markets often produce better results than breakouts from already-trending markets. The idea is that a flat period building energy tends to produce a cleaner, more sustained move when it finally breaks.
If ADX(15) < 20 then Buy at Highest(High, 10) stop
If ADX(15) < 20 then SellShort at Lowest(Low, 10) stop
ATR-based breakout threshold: Instead of just hitting a new high, require the price to move a full ATR unit beyond the previous close before triggering. This filters out marginal breakouts that are really just noise.
Buy at Close + (ATR multiplier × ATR) stop
SellShort at Close – (ATR multiplier × ATR) stop
Day-of-Week and Time-Based Entries
This one surprises people, but specific markets genuinely behave differently on different days. The weekly energy inventory report comes out every Wednesday. Grain reports hit on Fridays. Federal Reserve announcements cluster on specific calendar days.
A day-of-week entry captures these predictable behavioral patterns. The key is having a reason before you test not finding a day that worked historically and calling it a signal.
Example logic: if it’s Wednesday at 9:35 AM and price breaks above yesterday’s high, go long. If it’s Thursday and price breaks below yesterday’s low, go short.
If time = 935 AND dayofweek = Wednesday then Buy at previous day’s high stop
If time = 935 AND dayofweek = Thursday then SellShort at previous day’s low stop
Adding a momentum confirmation makes this more selective: only take the Wednesday buy signal if the current close is also above where it was 10 bars ago. That extra filter cuts false signals significantly.
Important note: time-based entries only make sense on intraday (minute) bars. On daily charts, remove the time constraint.
Percentile-Based Entries (Mean Reversion Logic)
This entry buys when price is in the upper 75th percentile of the last 25 bars, and sells short when it’s in the lower 25th percentile. The logic runs contrary to momentum: high prices lead to higher prices, low prices lead to lower prices.
It works in trending markets. In flat or reverting markets, the opposite is true.
That’s why an ADX filter helps here too but this time, you want a moderate trend, not a flat or explosive one. ADX between 20 and 30 is the sweet spot: enough trend to sustain a move, not so strong that a reversal is overdue.
Value1 = 25th percentile of close, last 25 bars
Value2 = 75th percentile of close, last 25 bars
If ADX(14) > 20 AND ADX(14) < 30: SellShort if close < Value1 Buy if close > Value2
RSI and Oscillator Entries
RSI (Relative Strength Index) triggers entries based on overbought/oversold readings. Classic usage: buy when RSI drops below 30, sell short when it climbs above 70.
The Stochastic oscillator works on a similar principle. A stochastic cross where %K crosses above %D below the 20 level is a classic oversold entry signal.
The Commodity Channel Index (CCI) measures where price sits relative to its statistical average. High CCI values suggest the market is overextended; low values suggest the opposite.
All these oscillators share one weakness: they generate lots of signals in trending markets that look wrong in the moment but aren’t. A strong trend produces RSI readings that stay “overbought” for weeks. Pairing these entries with a trend filter (like ADX or a moving average direction check) reduces the noise.
Moving Average Cross Entries
The moving average crossover has been around forever, and it still works in the right context. The logic: when a short-period average crosses a long-period average in a given direction, it signals a shift in trend.
A standard implementation uses a 5-period and 10-period average. But a twist that improves results: only take the signal if the close is on the correct side of the short average at the moment of the cross. That is, for a buy signal, the fast MA crosses below the slow MA (counter to what you’d expect), but the close is also below the short MA meaning you’re entering in a weakened moment, anticipating a reversal.
This “modified” crossover has shown better performance in stock and stock index markets than the traditional version.
Intraday-Specific Entry Rules
Intraday trading adds a dimension that daily strategies don’t have: time of day.
Certain hours are more tradeable than others. For equities, the 9:45–10:45 AM Eastern window captures the post-open volatility settlement. For energy futures, the 10:30–11:30 AM window aligns with the EIA inventory release window.
An intraday breakout entry restricts signals to these meaningful windows, only fires if ADX confirms a trend, and uses the previous day’s high and low as the breakout levels.
Adding a range expansion condition sharpens it further: the range of yesterday (high minus low) must exceed the range of two days ago. Range expansion often precedes continued volatility, making breakouts during these periods more likely to follow through.
The Exit Rules Nobody Talks About Enough
This is where most algo trading content goes shallow. Everyone covers entries. Exits get a paragraph about stop-losses and profit targets.
Real systematic trading requires the same rigor on exits as on entries. Here’s a breakdown of the main exit architectures.

Timed Exits
The simplest exit: close the position after N bars, regardless of where price is.
This sounds too basic to work. But timed exits have two powerful properties:
- They force you to define your holding period before you enter. That’s good discipline.
- They prevent a trade from lingering indefinitely, turning a short-term setup into an accidental long-term position.
A common implementation closes a position at the end of the trading day (5-day bars) or after a fixed number of bars. A calendar-based variant closes at a specific date or time, useful for strategies tied to report releases or seasonal windows.
Percentile-Based Exits
Mirror of the percentile entry: exit when price reaches a specific percentile of its recent range.
If you entered long because price was in the top 25% of its range (expecting continuation), exit when it hits the 90th or 95th percentile. The position has made its move; holding further just adds risk for marginal gain.
Profit Protection Exits (Tiered Trailing Stops)
This is the most sophisticated exit type in a retail trader’s toolkit, and it’s significantly underused.
Standard trailing stops move with price at a fixed distance. That works, but it applies the same logic whether you’re up $500 or $5,000. A tiered system adjusts how much profit you protect as the position grows:
- At $1,000 profit: protect 60% of the peak gain
- At $2,000 profit: protect 75% of the peak gain
- At $3,000 profit: protect 90% of the peak gain
The math: if your maximum position profit hits $3,000 and then drops back so your current open profit is only 88% of that peak, the exit fires. You keep most of the gain without needing to predict the top.
If max profit >= $1,000: exit if current profit < 60% of max profit
If max profit >= $2,000: exit if current profit < 75% of max profit
If max profit >= $3,000: exit if current profit < 90% of max profit
Structural Price Exits (Swing High/Low)
Some exits don’t track profit at all they track price structure. Exit a long when price hits the 10-bar highest high. Exit a short when it hits the 10-bar lowest low. Use a tighter 7-bar reading for the loss exit.
This approach mirrors how discretionary traders think about support and resistance, but formalizes it into a testable rule. Limit orders for profitable exits, stop orders for loss exits. The asymmetry matters: you don’t want to chase winners through limit orders, and you don’t want to wait on a market order when your stop is hit.
How to Combine Entries and Exits Into a Complete Strategy
A complete algo strategy needs 4 components:
- Long entry rule
- Short entry rule
- Long exit rule
- Short exit rule
Position sizing is a separate layer added later. The strategy logic itself needs all four pieces or it’s incomplete.
A practical starting point:
Take a breakout entry (Entry: highest high of 20 bars) paired with a timed exit (Exit: after 5 bars, close at market). Backrest it across 5–10 different markets. Look at the equity curve shape, the average trade profit, the win rate. Then modify one element try a 10-bar timed exit instead of 5. Or replace the timed exit with a profit protection exit.
Document every test. The only way to know what’s actually improving performance vs. what’s random variation is to keep records of what you changed and what happened.
One common mistake: optimizing until a test looks good, then calling it done. That’s curve-fitting. The backtest result is noise if you changed 15 parameters to get there. A real edge shows up consistently across parameter variations, not just at one specific setting.

Testing Your Strategy: What Good Results Look Like
Historical performance is necessary but not sufficient. A few things to look for:
Equity curve shape: A smooth, upward-sloping curve is better than a hockey stick that makes all its gains in one month. Consistency suggests the strategy is capturing a real, repeatable edge.
Win rate vs. average win size: A 40% win rate is fine if your average winner is 3× your average loser. A 70% win rate can still be unprofitable if the losers are huge. Look at both.
Drawdown: How much did the strategy lose from peak to trough during testing? If you can’t stomach that drawdown emotionally, the strategy won’t work for you in live trading even if the numbers look good.
Out-of-sample validation: Split your historical data. Develop on one portion, test on the remainder. If performance collapses on the out-of-sample data, the strategy was overfit to the development period.
The hardest part of systematic trading isn’t finding entries. It’s resisting the urge to keep tweaking until the backtest looks perfect.
Reversing Entry Signals: An Underused Technique
Most published entries only test one direction. But any entry rule can be flipped.
If your long entry fires when the 5-bar close crosses above the 10-bar close, the short entry is when the 5-bar crosses below. That’s obvious. But you can also reverse the entire logic: instead of buying breakouts, fade them. Instead of buying momentum, fade it.
Many traders never test the reverse of their entries. Some reversals genuinely work better than the original direction in specific markets. You won’t know until you test it.
FAQ: Trading Entry and Exit Rules
What’s the difference between an entry rule and a trading signal? They’re essentially the same thing. An entry rule is the coded condition that generates a trading signal. When the condition is met say, price breaks a 20-bar high the signal fires and the algorithm place an order.
Should I use the same exit rule for every strategy? No. The exit should match the entry’s logic. A momentum-based entry expects price to keep moving, so a trailing stop or timed exit makes sense. A mean-reversion entry expects a snapback, so a fixed profit target or percentile exit fits better.
How many conditions should an entry rule have? 2 to 4 conditions is the practical ceiling for most systematic retail traders. More than that and you’re likely fitting to historical noise. The simpler the rule, the more likely it generalizes to new data.
What’s a timed exit and when should I use it? A timed exit closes a position after a fixed number of bars or at a specific time, regardless of profit or loss. It’s useful when your entry idea has a natural expiration a news catalyst, a seasonal pattern, an intraday window. It also prevents trades from drifting into unintended holding periods.
Can I use the same entry for stocks, futures, and forex? Some entries work across asset classes; many don’t. A day-of-week entry tied to the energy inventory report is meaningless for a stock. An ATR-based breakout can work across all three, but the parameters (ATR multiplier, lookback period) will likely differ. Always test in the specific market you intend to trade.
Is a stop-and-reverse the same as having an exit? Yes, but most traders don’t realize it. If your entry rule fires in the opposite direction of your current position, you’re effectively exiting that position and entering a new one. That counts as an exit, even if you never explicitly coded one. Understanding this distinction helps you see that every strategy already has some form of exit built in.
Recommended Internal Topics to Explore Next
If this article gave you a solid foundation, here are the natural next steps:
- How to backtest a trading strategy: the proper walk-forward testing process, avoiding curve-fitting, and interpreting equity curves
- ADX indicator explained for systematic traders: how to use trend strength as a filter rather than a directional signal
- ATR-based position sizing: how average true range translates from an entry tool to a risk management calculation
- Day-of-week effects in futures markets: research on systematic calendar patterns across energies, metals, and grains
- Building a trading strategy from scratch: combining entries, exits, and position sizing into a complete algorithm
Final Verdict
The single biggest improvement most traders can make to their algo development process is giving exits the same attention as entries.
Start with a simple entry a breakout, a moving average cross, a day-of-week trigger. Pair it with 2 or 3 different exits and backrest each combination across multiple markets. The entry is the spark; the exit is how long the fire burns and whether you walked away with your eyebrows intact.
Keep rules simple. Test across markets. Document everything. Reverse the signals. And never optimize your way to a great-looking back test optimize for robustness across a range of parameters.
Expert Tip
The most overlooked edge in systematic trading is in the exit, specifically the tiered profit protection structure. Fixed trailing stops leave money on the table on big winners and get stopped out too early on moderate winners. A tiered system where you protect 60% at $1,000 profit, 75% at $2,000, and 90% at $3,000 lets winning trades breathe while still locking in meaningful gains. Test this against a standard fixed trailing stop on your current strategy. The difference in long-term performance is often significant.
You could certainly see your skills in the article you write.
The sector hopes for even more passionate writers like you who aren’t afraid to say how they believe.
All the time go after your heart.
What’s up, all is going fine here and ofcourse every
one is sharing information, that’s in fact excellent, keep
up writing.