

How to refine order blocks for safer trade entries is the question that separates traders who’ve learned the basic concept from traders who can actually use it profitably. Most beginners learn to spot an order block, mark a box on the chart, and wait. Few ever learn that the raw order block is usually too wide, too risky, and too imprecise to trade with confidence as-is and fewer still know how to tell a genuine order block apart from a rejection block, or a fresh block from one that’s already been used up.
This guide covers everything: what an order block actually is, the difference between an order block and a rejection block, how to refine a block into a tight entry zone, how to identify the best block among several candidates, what “mitigation” means and why it matters, worked examples in both directions, the safer-entry-versus-risk-entry decision framework, and the fractal validation concept that confirms whether the structure you’re reading is reliable in the first place.
A Quick Recap: What an Order Block Actually Is
An order block is the last opposing candle before a strong, impulsive move in price. If price breaks a recent high or low with force (a full-body break of structure), the order block is the last candle in the opposite direction before that impulsive move began. A bearish break of structure means the order block is the last bullish candle before the move down. A bullish break means it’s the last bearish candle before the move up.
The logic: that candle represents the last cluster of orders from the losing side before institutional buying or selling overwhelmed them. When price returns to that zone later, there’s a reasonable chance the same imbalance of orders causes a reaction.
The problem beginners run into immediately: the order block, as originally identified, is often a wide, clumsy zone. Trading directly off that raw zone means a wider stop-loss, a worse risk-to-reward ratio, and more false signals. Refinement solves this.
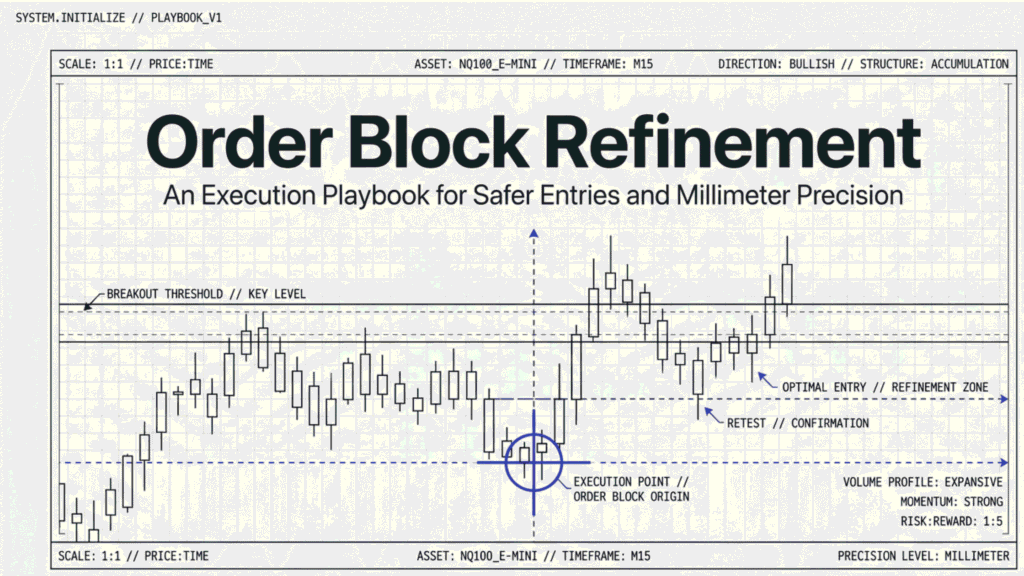
This concept applies identically whether you trade forex, futures, or stocks. The mechanism institutional orders clustering before an impulsive move isn’t asset-specific. Forex traders tend to work with order blocks on lower time frames (5-minute to 4-hour) because of how frequently currency pairs trade throughout a 24-hour session. Futures traders often work from daily and 4-hour order blocks down to hourly entries, since futures markets have defined sessions with their own opening ranges. The identification and refinement process is the same in both cases.
Order Block vs Rejection Block: The Distinction Most Traders Miss
These two concepts get confused constantly, and the confusion causes real trading mistakes.
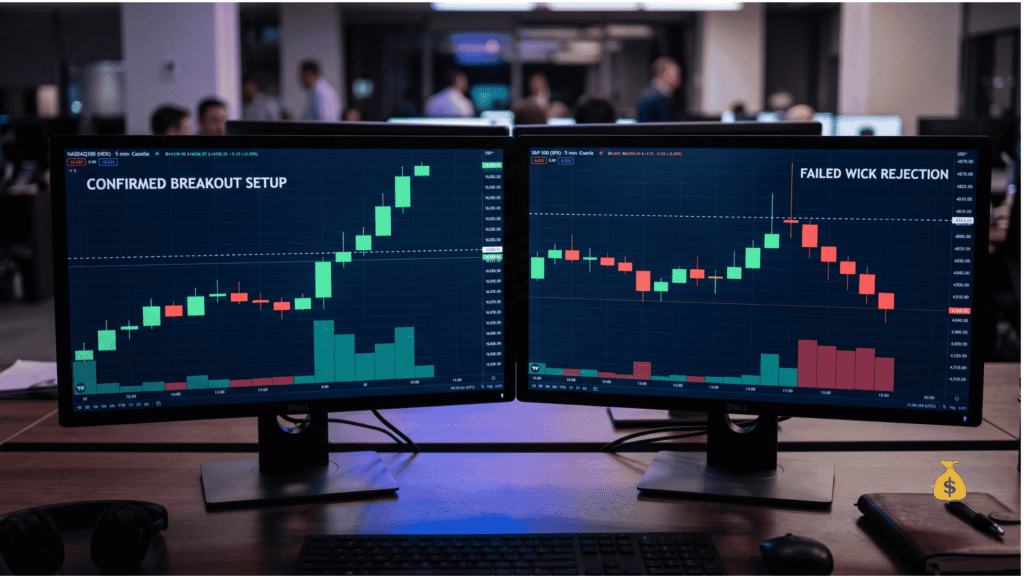
An order block is the last opposing candle before an impulsive move that also produces a break of structure. The defining feature is the BOS price must break a prior significant high or low for the zone to qualify as a true order block.
A rejection block is different. It forms at a candle with a long wick (upper or lower) that shows a sharp rejection of a price level, but without necessarily producing a confirmed break of structure afterward. Rejection blocks mark where price was firmly pushed back, but they carry less structural weight than an order block because there’s no accompanying BOS confirming that the broader trend has shifted.
Table 1: Order Block vs Rejection Block
| Factor | Order Block | Rejection Block |
|---|---|---|
| Requires a break of structure | Yes | No |
| Identified by | Last opposing candle before impulsive move | Candle with a long rejection wick |
| Structural weight | Higher — confirms a shift | Lower — shows rejection only |
| Best used for | Primary entry zones | Secondary confirmation, or in ranging markets |
| Risk of false signal | Lower | Higher |
Practically, this means: don’t treat every long-wicked candle as a tradeable order block. If there’s no break of structure attached to it, you’re looking at a rejection block, which deserves less confidence and, if used at all, should be treated as a secondary confluence factor rather than a primary entry trigger.
How to Identify the Best Order Block When Several Are Present
It’s common to find multiple order blocks sitting on a chart at once one on the daily, one on the 4-hour, one on the 1-hour, sometimes 2 or 3 candidates on the same time frame within a single swing. Here’s the checklist for picking the one actually worth trading.
Table 2: Order Block Quality Checklist
| Criterion | What to Look For |
|---|---|
| Break of structure confirmed | A full-body close beyond the prior swing high/low, not just a wick |
| Freshness (not yet mitigated) | Price hasn’t already returned to and moved through this zone since it formed |
| Alignment with higher time frame bias | The block sits in the direction your higher time frame trend already favors |
| Clean origin candle | The block candle itself isn’t excessively large or overlapping heavily with neighboring candles |
| Confluence with other tools | Sits near a Fibonacci golden pocket, a round number, or a prior significant level |
When multiple valid blocks exist, the freshest one that aligns with your higher time frame bias and hasn’t yet been mitigated is almost always the better choice over an older, previously-tested zone.
Order Block Mitigation and Efficiency: When a Block Stops Working
This is the concept most beginner content skips entirely, and it’s one of the most practically important ideas in this entire framework.

An order block is considered mitigated once price has returned to that zone and traded through it, especially if it closed beyond the block’s range. Once mitigated, the original imbalance of orders that created the block has likely already been filled the institutional orders sitting there have probably already been executed. Trading off a mitigated block is trading a zone that’s already done its job.
Order block efficiency refers to how cleanly and completely price reacted the first time it returned to the zone. A highly efficient reaction means price touched the block, reversed sharply, and moved away with strength a sign the zone genuinely held real interest. A low-efficiency reaction means price barely tapped the zone, chopped around inside it, or only partially reversed before continuing through it anyway a sign the zone’s power was weaker than expected, or partially already used up.
Table 3: Reading Order Block Efficiency
| Reaction Type | What Happened | What It Suggests |
|---|---|---|
| Sharp, immediate reversal | Price touched and left quickly with strong momentum | High-efficiency block, genuine interest |
| Choppy consolidation inside the zone | Price lingered, produced small candles, no clear direction | Lower efficiency, weaker signal |
| Partial reversal then continuation through | Price moved back briefly, then broke through the zone anyway | Zone likely mitigated / losing power |
| Full close beyond the zone | Price closed a candle body past the block’s far edge | Block is now mitigated — don’t re-trade it |
The practical rule: once a block has been touched and closed through, treat it as used up. Look for the next fresh block that forms afterward rather than expecting the same zone to hold a second time. Some blocks do produce a second reaction, but the odds meaningfully favor fresh, unmitigated zones over ones that have already been tested and broken.
Fair Value Gaps: The Confluence Tool Most Order Block Traders Pair With Refinement
An order block rarely stands alone in a serious trader’s analysis. The most common companion tool is the Fair Value Gap, often shortened to FVG, and understanding it materially improves how precisely you refine an entry.

A Fair Value Gap is a 3-candle pattern where the high of the first candle and the low of the third candle don’t overlap, leaving a visible, untraded gap in price. This gap forms during a strong, fast, impulsive move exactly the kind of move that creates order blocks in the first place. The gap represents a stretch of price where buyers or sellers moved so aggressively that the market didn’t trade in an orderly, two-sided way. Because of that imbalance, price frequently returns to “fill” or partially fill that gap before continuing in its original direction.
Why FVGs matter for order block refinement specifically: when an order block and a Fair Value Gap sit close together or overlap, that overlap is one of the strongest forms of confluence available. The order block marks where institutional orders likely sit. The FVG marks a specific untraded price range the market is statistically likely to revisit. When your refined order block zone lines up with an FVG from the same impulsive move, you have 2 independent tools pointing at the same precise entry area rather than just one.
Table 9: Using FVGs to Refine Order Block Entries
| Scenario | What It Suggests |
|---|---|
| OB and FVG overlap closely | Strong confluence — higher-confidence entry zone |
| FVG sits just above/below the OB | Still useful — price may react at the FVG edge before reaching the OB |
| No FVG present near the OB | The OB can still be traded, just without this extra confirmation layer |
| Price already filled the FVG completely | That confluence factor is used up — rely on the OB and mitigation status alone |
A practical refinement approach: once you’ve located your order block using either the “moving left” method or the lower time frame method, check whether a Fair Value Gap from the same impulsive move sits within or adjacent to that zone. If it does, you can often place your limit order at the edge of the FVG closest to the order block, rather than at the open or 50% mark of the OB itself this typically produces an even tighter, earlier entry than the OB alone would give you.
Reclaimed Order Blocks: When a Failed Zone Flips Direction
Sometimes an order block doesn’t simply get mitigated and forgotten it gets broken through with enough force that it flips and starts acting as a zone in the opposite direction. This is called a reclaimed order block.
Here’s how it happens. Price forms a bullish order block, and for a while it holds as expected. Eventually, though, price breaks down through that same zone with a strong, full-body impulsive move to the downside. That original bullish order block has now been “reclaimed” by sellers it can start acting as resistance (a bearish zone) going forward, essentially inverting its original role.
Table 10: How a Reclaimed Order Block Forms
| Step | What Happens |
|---|---|
| 1. Original order block forms | E.g., a bullish OB holds and produces upward moves as expected |
| 2. Zone eventually fails | Price breaks back through the OB with a strong, full-body candle in the opposite direction |
| 3. Reclamation confirmed | The break isn’t just a wick — it’s a decisive, structural break through the zone |
| 4. Role inverts | The former bullish OB can now act as a bearish zone (resistance) on future retests |
Reclaimed order blocks matter because they explain why a zone that “should” have held sometimes doesn’t and why, once it fails decisively, continuing to expect it to act as support (or resistance) in its original direction is a mistake. If you notice your order block has been broken through with real conviction rather than just a brief wick, don’t keep trying to trade it in the original direction. Reassess whether it has flipped into a reclaimed zone working against you instead.
Method 1: Refining by Moving Left
The simplest refinement technique doesn’t require switching to a lower time frame at all.
Once you’ve identified your order block (the last opposing candle before the impulsive move), look at the candle immediately before it. Ask: did that candle stay within the range of the order block candle, or did it also participate meaningfully in the move?
If the candle before your identified order block didn’t break the range of the OB candle, and the next candle after it was the one that made the real impulsive move, you can shift your order block designation to that earlier, tighter candle. This gives you a narrower zone, closer to where price actually reversed, which means a tighter stop-loss and a better risk-to-reward ratio on the same trade.
Table 4: Refining by Moving Left — What to Check
| Check | What It Means |
|---|---|
| Does the candle before your OB stay within its range? | If yes, it may be the better OB |
| Did the impulsive move only begin at the next candle? | Confirms the earlier candle is the true origin |
| Is the resulting zone narrower? | Tighter zone = tighter stop, better R:R |
Method 2: Refining Down to a Lower Time Frame
The second refinement method requires more work but produces a significantly more precise entry zone.
Once you’ve marked your order block on a higher time frame (say, the 1-hour chart), drop down to a much lower time frame 5-minute or even 1-minute. Within the range of that higher time frame order block, look for a clear, distinct order block on the lower time frame. This nested, lower time frame OB becomes your refined entry zone.
Table 5: Time Frame Refinement Example
| Time Frame | Order Block Width | Precision |
|---|---|---|
| 1-hour OB | Wide (the entire candle range) | Low |
| 5-minute OB nested inside | Narrow (a fraction of the 1-hour candle) | High |
| 1-minute OB nested inside | Very narrow | Very high, but requires more screen time |
You can repeat this process across as many time frames as you’re willing to work through. Each step down typically narrows the zone further. The trade-off is time and effort: refining down to the 1-minute chart takes considerably longer to locate a clean setup than stopping at the 5-minute level.
One important piece of guidance: if you’re comfortable with the risk-to-reward ratio produced by a particular time frame’s order block, stop there. Don’t keep refining further out of greed, and don’t force yourself down to lower time frames if doing so makes you anxious about execution speed or screen time. The right level of refinement is the one that matches your own trading comfort, not the theoretical tightest possible zone.
Worked Example: Bullish Order Block Trade
Here’s a complete walkthrough tying the concepts together.
Step 1 — Higher time frame bias. On the daily chart, price has been making higher highs and higher lows for several weeks. Bias: bullish.
Step 2 — Locate the point of interest. On the 1-hour chart, price rallies sharply, breaking a recent swing high with a full-body candle. The last bearish candle before that rally is the raw order block.
Step 3 — Check for mitigation. This zone hasn’t been touched since it formed. It’s fresh. Good.
Step 4 — Refine. Moving left, the candle before the raw OB also stayed within a tight range, and the real impulsive move only began one candle later. The OB shifts to this tighter, more precise candle.
Step 5 — Choose entry style. For a safer entry, wait for price to return to this zone, then drop to the 5-minute chart and wait for a bullish break of structure there before entering. For a risk entry, place a limit order directly at the 50% mark of the refined zone as soon as price taps it.
Step 6 — Set stop and target. Stop-loss goes just below the low of the refined order block. Target is the most recent swing high, with the option to extend the target if the daily chart’s broader order flow supports further upside.
Worked Example: Bearish Order Block Trade
Step 1 — Higher time frame bias. Price on the daily chart has been making lower highs and lower lows. Bias: bearish.
Step 2 — Locate the point of interest. On the 4-hour chart, price drops sharply, breaking a recent swing low with a full-body candle. The last bullish candle before that drop is the raw order block.
Step 3 — Check for mitigation. Price already returned to this zone once and closed through the top of it. This block is mitigated — skip it and wait for the next one to form.
Step 4 — Wait for a fresh block. A new bearish break of structure occurs on a subsequent rally attempt, producing a new, unmitigated order block.
Step 5 — Refine and enter. Drop to the 15-minute chart, find a nested order block within this new zone, and enter using either the safer or risk entry method depending on how much momentum is already present.
Step 6 — Set stop and target. Stop-loss above the high of the refined zone. Target the most recent swing low.
Safer Entry vs Risk Entry: The Decision Framework
Once you’ve identified, validated, and refined your order block, you have 2 fundamentally different ways to enter the trade.
The Safer Entry
Wait for price to return to your higher time frame point of interest. Drop to a lower time frame. Wait for that lower time frame to itself produce a break of structure and its own order block within the higher time frame zone. Once that lower time frame OB is confirmed, place a limit order at the open of that OB, or at the 50% mark of it.
Advantages:
- More confirmation before you commit capital
- Often produces a better risk-to-reward ratio, since your stop can sit tighter beneath a validated lower time frame structure
Disadvantages:
- More time-consuming you’re waiting for 2 separate confirmations (the higher time frame tap, then the lower time frame BOS)
- Occasionally, price simply reverses directly from the higher time frame OB without ever forming a clean lower time frame BOS, meaning you miss the trade entirely
The Risk Entry
Skip the lower time frame confirmation. As soon as price taps your higher time frame order block, enter directly with a limit order at the open or 50% mark of that zone, stop below the low, target the recent high or low depending on direction.
Advantages:
- Captures trades that never produce a clean lower time frame setup
- Faster no waiting for a second confirmation
Disadvantages:
- Meaningfully riskier no confirmation that the zone will actually hold
- Works best specifically when there’s already strong momentum in your intended direction; performs poorly in consolidating, directionless markets
Table 6: Safer Entry vs Risk Entry — Quick Comparison
| Factor | Safer Entry | Risk Entry |
|---|---|---|
| Confirmation required | 2 (higher TF tap + lower TF BOS) | 1 (higher TF tap only) |
| Speed | Slower | Faster |
| Missed trade risk | Higher (may never get lower TF confirmation) | Lower |
| Best market condition | Any | Strong existing momentum only |
| Typical risk-to-reward | Often better | Often worse |
Neither approach is universally correct. The right choice depends on your own risk appetite and how comfortable you are trading without the second layer of confirmation. Trading is personal you don’t need to copy what any other trader does; you need a method you can execute consistently and calmly.
The Swing High and Swing Low: A Building Block for Structure
Before any order block matters, you need a reliable way to identify genuine swing highs and swing lows on the chart. This is where a simple 3-candle pattern becomes useful.
A valid swing high pattern: 3 candles where the middle candle’s high is higher than both the candle before and after it. A valid swing low pattern: 3 candles where the middle candle’s low is lower than both the candle before and after it. The color of the candles doesn’t matter only the pattern of highs, lows, and closes across the 3 candles.
To confirm the pattern is valid (not just a temporary blip), the close of the third candle matters. That close is what confirms the market has genuinely shifted direction at that point, rather than just producing a brief wick that gets erased.
This 3-candle swing pattern is fractal in nature meaning the exact same pattern is valid whether you’re looking at a 1-minute chart or a monthly chart. A swing high on the 1-hour chart tells you the same thing structurally as a swing high on the daily chart; only the significance and duration of the resulting move differs.
Understanding Fractals: Why Market Structure Repeats at Every Scale
The concept of a fractal comes from mathematics a fractal is a structure that repeats itself at different scales. Zoom in, and you see the same shape again. This same principle appears in financial markets and understanding it is what lets you validate whether the market structure you’re reading is genuinely reliable.

There are 2 practical ways to use fractals when reading price:
1. Repeating patterns across time periods. The same price pattern that occurred in one period sometimes reappears in a completely different period. This isn’t mystical it reflects the fact that the underlying behavioral and structural forces driving markets (the interaction of large numbers of participants making similar decisions under similar conditions) tend to produce similar shapes over and over.
2. A fractal as a sequence of highs and lows. Every time price breaks its previous significant high (in an uptrend) or previous significant low (in a downtrend), a fractal is considered complete. This is the more immediately practical definition for day-to-day trading.
Bullish and Bearish Fractals
A bullish fractal is a series of consecutively higher highs. A bearish fractal is a series of consecutively lower lows. Inside any larger fractal, smaller fractals typically exist meaning the structure you see on a higher time frame is usually built from smaller versions of the same structure on lower time frames.
The Valid Fractal Rule: The 100% Retracement Test
This is the single most useful practical rule for validating whether a fractal (and by extension, the market structure you’re reading) is still intact.
When a bullish fractal is forming, the retracement (pullback) should generally stay somewhere between 50% and 88% of the prior bullish move but it must not retrace more than 100% of that prior move. If price retraces beyond 100% of the previous impulsive move, the fractal is invalidated. It’s no longer a fractal continuing in the original direction; something has changed.
Table 7: The 100% Retracement Rule
| Retracement Depth | What It Means |
|---|---|
| 0-50% | Shallow pullback, fractal likely still valid and strong |
| 50-88% | Normal retracement range, fractal generally still valid |
| Near 100% | Fractal at risk — pay close attention |
| Beyond 100% | Fractal invalidated — structure has changed |
Once a bullish fractal is confirmed (price makes a new low that stays within the 100% threshold, then breaks the prior high again), the expectation shifts: the market should continue forming higher highs and higher lows in a zigzag pattern. If you’re trading with the trend, you should be looking primarily for buying opportunities on pullbacks, not for breakout shorts against the established structure.
Forms of Accumulation: Recognizing the Setup Before It Completes
Beyond individual order blocks and fractals, price tends to build up in one of a few recognizable accumulation shapes before a significant directional move. Recognizing which shape is forming lets you anticipate the move rather than react to it after the fact.
Table 8: Common Accumulation Structures
| Structure | Description |
|---|---|
| Lateral accumulation | Price moves sideways within a horizontal range for an extended period before breaking out |
| Channel accumulation | Price moves within a rising or falling parallel channel, distinct from a genuine impulsive move |
| Diamond accumulation | Price forms a diamond-shaped consolidation pattern, often producing a strong continuation when it resolves in the direction of the prior trend |
Diamond accumulation in particular tends to produce excellent results when it appears within the order flow of an established trend it’s sometimes described as a flat variation of a continuation pattern within Elliott Wave theory. These same structures can appear in a bearish context as distribution patterns, and the same recognition principles apply, just mirrored.

Bringing It Together: A Complete Practical Sequence
Here’s how every piece in this guide fits into one coherent process, step by step:
- Identify your higher time frame directional bias using swing highs and swing lows, confirmed by the 3-candle pattern
- Validate that the structure is a genuine fractal using the 100% retracement rule if price has retraced beyond 100% of the prior move, don’t trust the current structure
- Locate your order block on the time frame that matches your trading style (higher time frames for swing entries, lower time frames for intraday)
- Confirm it’s a true order block, not a rejection block check that a genuine break of structure accompanies it
- Check whether the block has already been mitigated skip zones that have already been touched and closed through
- Refine the order block either by moving left to find a tighter originating candle, or by dropping to a lower time frame to find a nested, more precise zone
- Choose safer or risk entry based on whether you want the extra confirmation of a lower time frame break of structure, or whether existing momentum justifies a more direct entry
- Set your stop-loss below the low of the refined zone (for longs) or above the high (for shorts), and target the most recent relevant swing high or low
Frequently Asked Questions
What is an order block in trading?
An order block is the last opposing candle before a strong, impulsive price move that also produces a break of structure. If price breaks a recent high with a full-body candle, the order block is the last bearish candle before that upward move began. These zones are watched because they often mark where large institutional orders were placed, making them potential reaction points when price revisits them.
What is the difference between an order block and a rejection block?
An order block requires a confirmed break of structure price must close beyond a prior significant high or low. A rejection block is identified by a long wick showing a sharp price rejection, but without necessarily producing a break of structure. Order blocks generally carry more structural weight and reliability than rejection blocks, which are better used as secondary confirmation rather than primary entry triggers.
How do you refine an order block?
Two main methods. First, check whether the candle before your identified order block also stayed within a tight range and shift your zone to that earlier, narrower candle if so. Second, drop to a lower time frame and look for a distinct, smaller order block nested within your original higher time frame zone. Both methods produce a tighter entry zone, which allows for a closer stop-loss and a better risk-to-reward ratio.
What does it mean when an order block is mitigated?
A mitigated order block is one that price has already returned to and traded through, especially if a candle closed beyond the block’s range. Once mitigated, the institutional orders that originally created the imbalance have likely already been filled, meaning the zone is less likely to produce a strong reaction a second time. Traders generally look for fresh, unmitigated blocks rather than re-trading zones that have already been used.
How do you identify the best order block when several are visible on a chart?
Prioritize blocks that have a confirmed break of structure, haven’t yet been mitigated, align with your higher time frame directional bias, and have a clean, well-defined origin candle. Additional confluence, such as alignment with a Fibonacci retracement zone or a significant prior price level, further strengthens the case for choosing one block over another.
What is the difference between a safer entry and a risk entry with order blocks?
A safer entry waits for price to tap the higher time frame order block, then requires a second confirmation a break of structure on a lower time frame before entering. A risk entry skips that second confirmation and enters directly once price reaches the higher time frame zone. Safer entries are slower but often have better risk-to-reward; risk entries are faster but only perform well when strong momentum already exists in the intended direction.
What is a fractal in trading and why does the 100% retracement rule matter?
A fractal is a repeating structural pattern in price a bullish fractal is a series of higher highs; a bearish fractal is a series of lower lows. The 100% retracement rule is a simple test for whether the current structure is still valid: as long as a pullback doesn’t retrace more than 100% of the prior impulsive move, the trend structure holds. Beyond that threshold, the fractal is invalidated, signaling the market’s underlying character has likely shifted.
About the Author — Jamaluddin K.A.
Jamaluddin is the founder of The First Time Investor, a US and UK-focused personal finance and investing education site. He covers trading strategy, market structure, and price action concepts for traders who want to move beyond basic technical analysis.
Disclosure: This article is for educational purposes only and does not constitute financial advice. Trading involves significant risk including the potential loss of principal. Consult a licensed financial advisor before making investment decisions.