

The 6 elements of investing every beginner must master sounds like a bold claim. Here it is anyway: everything you need to know about building lasting wealth fits on one hand. Maybe not even that.
Not because investing is simple. Because the principles that actually work are. The complexity you see everywhere else the 47-step trading systems, the sector rotation strategies, the exotic alternatives is mostly noise. Often expensive noise designed to benefit the people selling it, not the people buying it.
This guide covers the 6 foundational elements that have proven to work across a century of market data, two great depressions, multiple recessions, crashes, bubbles, and panics. No shortcuts. No hype. Just the things that actually matter.
Element 1: Save First, Invest Second
Everything in investing starts here. Not with which fund to buy. Not with whether the market is at a high or a low. With saving money in the first place.
The amount of capital you start with matters far less than organizing your life to save regularly and starting as early as possible. A schoolteacher who lives modestly, enjoys life, and invests consistently can leave an estate worth over $1 million real affluence after a lifetime of modest income. This isn’t theory. It happens. The common thread: they were savers.
The First Rule of Personal Finance
Before saving a single dollar, stop dis-saving. Running up credit card balances destroys wealth faster than almost any investment can build it.
Credit card debt at 18-22% APR compounds against you the same way investment returns compound for you. At 18%, a debt doubles in 4 years. Then doubles again in the next 4. A $5,000 balance becomes $10,000 by year 4, $20,000 by year 8. The banks issue these cards so widely for exactly this reason. Never, under any circumstances, carry a credit card balance.
The Rule of 72: The Most Useful Number in Investing
The Rule of 72 is the fastest mental math tool available for any investor.
X × Y = 72
Where X is the number of years it takes to double your money and Y is the rate of return.
Table 1: Rule of 72 in Practice
| Rate of Return | Years to Double Your Money |
|---|---|
| 3% | 24 years |
| 6% | 12 years |
| 7% | 10.3 years |
| 8% | 9 years |
| 10% | 7.2 years |
| 18% (credit card debt) | 4 years (working against you) |
The same rule applies in reverse. At 18% APR, your debt doubles every 4 years. At 10% returns, your investments double every 7.2 years. Which side of this equation you’re on makes all the difference.
Why Starting Early Matters More Than Amount
Consider two brothers, William and James, both now 65:
- William started at age 20. Invested $4,000 per year for 20 years ($80,000 total), then stopped completely at 40. Earned 10% per year tax-free.
- James started at age 40. Invested $4,000 per year for 25 years ($100,000 total). Same 10% return.
At age 65:
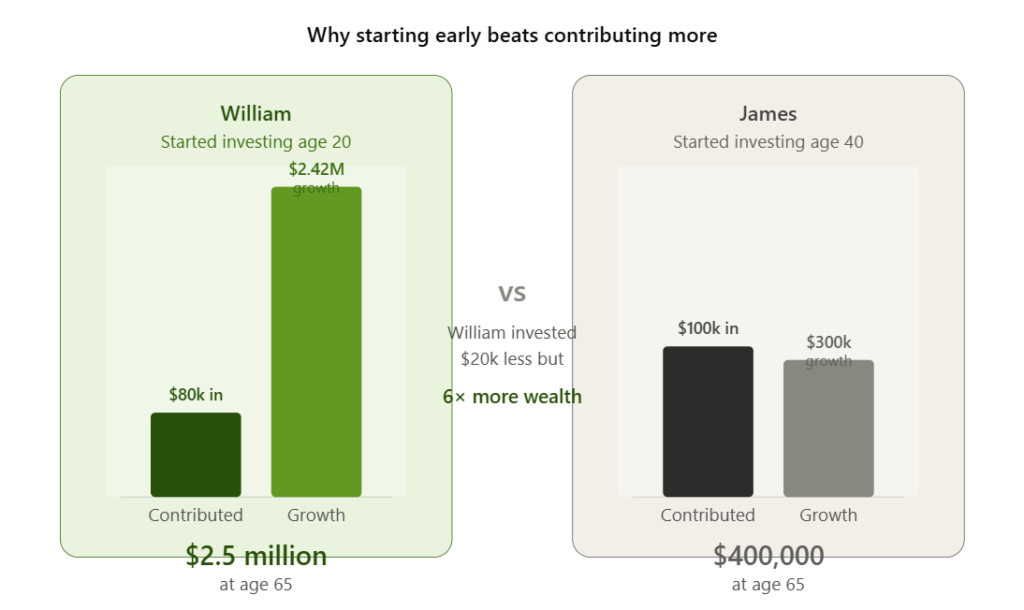
- William’s account: $2.5 million
- James’ account: $400,000
William invested less money. Started earlier. Ended up with 6 times more wealth. That’s compound interest working across time.
Small Savings That Add Up
Every month, look at your expenses and triage them into three buckets: best value, good value, and questionable value. Then eliminate or reduce the questionable ones.
Some immediate wins:
- Skip impulse purchases entirely — make a list before shopping and stick to it
- Swap the $5 daily coffee for a $1 cup — that’s $1,460 per year, or at 10% returns over 30 years, $256,000
- Buy term life insurance instead of whole life — it’s often half the cost for the same death benefit
- Automate savings: ask your employer to deduct 5-10% of your pay directly into your retirement account before you see it
The key psychological shift: think of every dollar spent today as the amount it could grow into at retirement. At 7% returns over 30 years, $1 today becomes $8 at retirement. Every dollar you spend casually in your 30s is $8 you won’t have in your 60s.
Let the Government Help You Save
Tax-advantaged accounts are among the most powerful wealth-building tools available. A 401(k) contribution reduces your taxable income today. A Roth IRA lets your money grow completely tax-free. Both accounts are one of the rare cases where the government actively incentivizes you to do the financially intelligent thing.
Taking full advantage of your employer’s 401(k) match is non-negotiable. That match is an immediate 50-100% return on your contribution. Nothing else available to investors comes close to that as a guaranteed return.

Element 2: Index — The Investment Strategy That Beats Almost Everyone
Here is a fact that should change how you think about investing: over any 10-year period, broad market index funds have regularly outperformed two-thirds or more of actively managed mutual funds.
Not sometimes. Regularly.
The data is overwhelming. For 20 years ending June 30, 2012, the S&P 500 index fund returned 8.34% annually. The average actively managed equity fund returned 7.00%. That 1.34% annual gap sounds small. Over 20 years on a $100,000 investment, it’s the difference between $482,000 and $386,000.
Table 2: Index Fund vs Active Management — 20 Year Performance
| Investment Type | Annual Return | $100,000 After 20 Years |
|---|---|---|
| S&P 500 Index Fund | 8.34% | $482,000 |
| Average Active Equity Fund | 7.00% | $387,000 |
| Advantage of indexing | +1.34%/year | +$95,000 |
And that shortfall compounds. Over 30 years, the gap is far larger.
Why Professional Managers Can’t Beat the Market
The explanation isn’t that professional managers are incompetent. Most are intelligent, hardworking, and well-resourced. The explanation is mathematical.
All the stocks in the market need to be held by someone. Professional investors collectively account for about 90% of all trading. As a group, they cannot beat the market because they are the market. For every professional who holds the stocks that outperform, another must hold the stocks that underperform. Before expenses, the average professional earns the market return. After expenses of 1% or more annually, they earn less.
Index funds charge one-tenth as much. That difference not skill is what drives the performance gap.
The Problem of Past Performance
The financial media constantly celebrates fund managers who have recently beaten the market. These managers appear on television. Investors pour money into their funds. Then something happens.
A Wall Street Journal study examined 14 equity mutual funds that had beaten the S&P 500 for 9 consecutive years through December 2007. In 2008, exactly 1 of those 14 funds beat the market.
The top-rated funds in any decade bear virtually no resemblance to the top-rated funds in the next decade. Past performance in fund management is approximately as predictive as a coin flip.
The one exception? Cost. High-cost funds reliably underperform. Low-cost funds reliably outperform. Ranking funds by expense ratio is a better predictor of future returns than any performance metric.
Bond Index Funds Are Even Better
If indexing outperforms in stocks, its superiority in bonds is even greater. Over 10 years through June 2012, 100% of actively managed short-term government bond funds were outperformed by their index equivalent. For intermediate-term government bonds, the figure was also 100%.
Table 3: Percentage of Active Bond Funds Beaten by Index (10 Years)
| Bond Category | Government | Corporate |
|---|---|---|
| Short-term | 100% | 94% |
| Intermediate-term | 100% | 97% |
| Long-term | 80% | 91% |
For global stocks, the results are consistent. Even in “less efficient” emerging markets where active management supposedly has an edge, index funds have regularly outperformed.
What to Index
Start with 2 funds. A total US stock market index fund (covering 3,000-5,000 US companies) and a total international stock market index fund (covering developed and emerging markets worldwide). These two funds give you ownership in virtually the entire global economy.
Add a total bond market index fund to reduce volatility as you approach retirement.
That’s 3 funds. That’s the entire portfolio for 90% of investors. Everything beyond this adds cost and complexity without meaningfully improving outcomes.
Element 3: Diversify — Never Put All Your Eggs in One Basket
A secretary at Enron put her entire retirement savings into Enron stock on the recommendation of her CEO. At its peak, her account was worth nearly $3 million. She looked forward to retirement and world travel.
When Enron collapsed in accounting fraud, her $3 million became $0. She lost not just her savings but her job. She made one devastating mistake: she failed to diversify.
The Enron story is not unique. Chrysler and General Motors went bankrupt. Lehman Brothers went bankrupt. Wachovia, one of the largest US banks, effectively went bankrupt. AIG required government rescue. These were not obscure companies. They were household names. And the investors who had concentrated positions lost almost everything.
Diversify Across Securities
A portfolio of hundreds of stocks is protected against any single company’s failure. If you own an index fund covering 3,000 US stocks, a single bankruptcy barely registers. One company going to zero out of 3,000 is a 0.03% event in a diversified portfolio. In a concentrated portfolio, it can be catastrophic.
Diversify Across Asset Classes
Table 4: Major Asset Classes and Their Roles
| Asset Class | Role in Portfolio | Behavior During Stock Crashes |
|---|---|---|
| US stocks | Growth | Falls |
| International stocks | Growth + diversification | Usually falls, but at different magnitudes |
| Bonds | Stability + income | Often rises (especially Treasuries) |
| Real estate (via index) | Inflation hedge | Varies |
| Cash / money market | Liquidity | Stable |
Bonds are the critical diversifier for most portfolios. In 2008, as stocks fell dramatically, US Treasury bonds rose in value as the Federal Reserve cut interest rates. A portfolio of 60% stocks and 40% bonds suffered far less than a 100% stock portfolio, and recovered faster.
The see-saw rule for bonds: when interest rates fall, bond prices rise. When interest rates rise, bond prices fall. During economic crises, central banks usually cut rates, which lifts bond prices just when stock prices are falling. That offsetting behavior is what makes bonds a genuine diversifier.
Diversify Across Global Markets
The United States represents less than half of global economic activity and stock market capitalization. Holding only US stocks means missing more than half the world’s investment opportunities. International stocks, particularly in fast-growing emerging markets, have provided meaningful additional returns in many periods.
During the “lost decade” of US stocks from 2000-2010, when the S&P 500 was essentially flat, emerging market stocks returned approximately 10% per year compounded. Diversification into emerging markets more than doubled the portfolio return during one of the worst decades for US equities in history.
Table 5: Diversification Into Emerging Markets — The Lost Decade (2000-2010)
| Portfolio | Approximate Annual Return |
|---|---|
| US stocks only (S&P 500) | ~0% |
| Emerging market stocks | ~10% |
| Diversified international portfolio | ~3-5% |
Diversify Across Time
Dollar-cost averaging is diversification across time. By investing a fixed amount at regular intervals, you automatically buy more shares when prices are low and fewer when prices are high.
A powerful demonstration: An investor who put $1,000 per year into a stock index fund starting in January 2000 — the absolute worst possible timing, at the height of the Internet bubble — and continued investing through both the dot-com crash and the 2008 financial crisis, still ended the decade with a moderate positive return and a growing retirement fund. The consistent investment bought shares cheaply during both crashes, lowering the average cost paid per share and building a larger position when prices recovered.
This is why dollar-cost averaging is one of the long-term investor’s best friends.
Element 4: Avoid Blunders — Stop Being Your Own Worst Enemy
You, far more than the market or the economy, are the most important factor in your long-term investment success.
The stock market as a whole has delivered approximately 9.5% annually over long periods. The average investor earned at least 2 percentage points less not because of bad markets, but because of bad behavior. Buying high, selling low, chasing performance, and panicking at market bottoms.
The Overconfidence Problem
Psychologists consistently find that the overwhelming majority of people rate themselves as above-average drivers, above-average athletes, above-average investors. We all confuse luck with skill when things go right.
During the Internet bubble of 1999-2000, owning technology stocks was easy. Prices went up. Returns were spectacular. Thousands of investors concluded they were brilliant stock pickers. When the same stocks fell 80-90%, they discovered they had been lucky, not skilled.
The most dangerous period in any investor’s career is after a period of good results. Success breeds overconfidence. Overconfidence breeds concentration and risk-taking. Concentrated bets and excess risk is where wealth gets destroyed.
The Market Timing Trap
More money poured into equity mutual funds during the fourth quarter of 1999 and first quarter of 2000 right at the market peak than ever before. More money came out of the market in the third quarter of 2002 than ever before right at the market trough. This pattern repeated in 2008: record redemptions at the bottom, right before the recovery.
Table 6: The Cost of Market Timing (S&P 500, Long-Term)
| Strategy | Approximate Annual Return |
|---|---|
| Buy and hold, fully invested | ~9.5% |
| Average investor (timing-impacted) | ~7.5% |
| Annual shortfall from market timing | ~2% |
| Cost over 30 years on $10,000 investment | ~$40,000+ |
The behavioral explanation: humans feel safety in numbers. During bull markets, optimism is contagious. Everyone is buying. Prices keep rising. The news is relentlessly positive. So people buy more. During bear markets, pessimism is equally contagious. Everyone is selling. Prices keep falling. News is catastrophically negative. So people sell more.
Both behaviors are backwards. Buying when optimism is highest means buying near peaks. Selling when pessimism is most convincing means selling near troughs.
Behavioral Biases That Cost Money
Loss aversion: Humans feel losses approximately twice as intensely as equivalent gains. This leads investors to sell winners to lock in gains (fear of losing the gain) and hold losers because selling would mean admitting a mistake.
The tax-smart move is the opposite. Selling losers generates tax deductions. Selling winners generates tax liabilities. But emotions override rational tax planning.
Pattern recognition: Human brains are wired to find patterns. In genuinely random data, we still see patterns. Charting stock prices and predicting future movements from past patterns is no more reliable than astrology. Changes in stock prices are very close to a random walk. There is no dependable method of predicting future price movements from past movements.
The fix is simple: Commit to a strategy in advance. Write it down. Decide in advance what you’ll do when the market falls 30%. If the answer is “keep buying,” write that down before the drop happens, when you’re thinking clearly. Then execute the plan when things get scary.
Element 5: Keep It Simple — The KISS Portfolio
Albert Einstein’s overriding principle for unlocking the secrets of the universe was “Make everything as simple as possible — but no simpler.” The same principle applies here.
Everything important about investing can be reduced to a portfolio you can build in one afternoon and manage with 30 minutes of attention per year.
The 8 Basic Rules in Brief
- Save early and regularly — compound interest requires time above all else
- Use employer 401(k) and tax advantages — the match is free money, the tax treatment adds thousands over decades
- Keep a cash reserve — 3-6 months of expenses in a high-yield savings account protects your investments from forced selling
- Get proper insurance — term life, disability, medical. Buy term, never whole life.
- Diversify broadly — hundreds of companies across multiple asset classes
- Avoid credit card debt — the only absolute rule in personal finance
- Ignore short-term market noise — focusing on the long term is your only job
- Use low-cost index funds — costs are the only reliable predictor of returns
Age-Based Asset Allocation
Your allocation between stocks and bonds should shift as you age. Stocks deliver higher long-term returns but more volatility. Bonds provide stability and income with lower growth. The right balance depends on your age, financial situation, and emotional capacity.
Table 7: Asset Allocation Ranges by Age Group
| Age Group | % in Stocks | % in Bonds | Rationale |
|---|---|---|---|
| 20s-30s | 80-100% | 0-20% | Long time horizon absorbs volatility |
| 40s-50s | 65-90% | 10-35% | Growth still important, some stability |
| 60s | 45-75% | 25-55% | Approaching withdrawal, reduce risk |
| 70s | 35-60% | 40-65% | Income and preservation |
| 80s+ | 20-50% | 50-80% | Capital preservation priority |
Note: if you plan to leave money to children or grandchildren, allocate based on their age, not yours. Money going to a 30-year-old grandchild has a 40-year time horizon regardless of your own age.
The 3-Fund Portfolio
For most investors, 3 funds cover everything:
- Total US stock market index fund — Vanguard VTI (0.03%), Fidelity FSKAX (0.015%), Fidelity FZROX (0%)
- Total international stock market index fund — Vanguard VXUS (0.07%), Fidelity FZILX (0%)
- Total US bond market index fund — Vanguard BND (0.03%)
This portfolio owns thousands of companies across every major economy on earth, plus a diversified bond portfolio. It costs between 0% and 0.05% annually. It requires one annual rebalance. That’s all.
One Warning: Not All Index Funds Are Equal
Beware index funds with high expense ratios. Some funds are labeled “index funds” but charge 0.5% or more annually. At that cost level, the main advantage of indexing low cost disappears. Look for funds charging 0.1% or less for US equity indexes. Vanguard, Fidelity, and Schwab all offer excellent options in this range.
For US domestic stock funds, expense ratios should be under 0.05%. For international and bond funds, aim for under 0.1%.
Element 6: Timeless Lessons for Troubled Times
Markets will always go through periods of extreme volatility. This is not a sign that the system is broken. Volatility is the price of long-term equity returns.
The decade from 2000 to 2010 was one of the toughest investment decades in modern history. The S&P 500 fell 50% when the Internet bubble burst. Then fell nearly 50% again during the 2008 financial crisis. At the end of 2010, the index was lower than it was in January 2000.
Yet an investor who invested $1,000 per year through that entire decade, starting at the January 2000 peak with perfect worst-possible timing, earned a moderate positive return and built a meaningful retirement fund. How? By buying shares throughout both crashes at dramatically reduced prices and reinvesting dividends throughout.
Rebalancing: The Counterintuitive Discipline
Rebalancing is the most mechanically straightforward way to force yourself to buy low and sell high.
If your target is 60% stocks and 40% bonds, and a strong stock market pushes you to 70% stocks, rebalancing means selling some stocks (at high prices) and buying bonds (at lower prices). If a crash drops you to 50% stocks, rebalancing means selling bonds (which have likely risen) and buying stocks (at lower prices).
Table 8: The Benefits of Annual Rebalancing (1996-2010)
| Strategy | Average Annual Return | Portfolio Volatility |
|---|---|---|
| 60/40 portfolio, annually rebalanced | 8.46% | 9.28 (lower) |
| 60/40 portfolio, never rebalanced | 8.08% | 10.05 (higher) |
| Advantage of rebalancing | +0.38%/year | Lower risk |
Over 15 years, the rebalanced portfolio added nearly 1.5 percentage points of annual return while reducing volatility. Not by picking better stocks. By mechanically selling what had gone up and buying what had gone down.
Rebalance once a year. Any more frequently creates unnecessary transaction costs and taxes. Set a calendar reminder and do it in your tax-sheltered account (IRA or 401k) to avoid capital gains taxes on the rebalancing trades.
The Four Best Friends of the Long-Term Investor
Every major market disruption of the past century — the Great Depression, the 1970s stagflation, the dot-com crash, the 2008 financial crisis — was followed by recovery. Investors who used the following 4 tools in combination came through not just intact but ahead.
Table 9: The Four Best Friends of the Long-Term Investor
| Friend | What It Does | Why It Works |
|---|---|---|
| Diversification | Spreads risk across assets | Not all assets fall together |
| Rebalancing | Forces buy-low, sell-high | Mechanical discipline removes emotion |
| Dollar-cost averaging | Spreads purchases across time | Buys more shares when prices fall |
| Indexing | Minimizes costs, captures market return | Lower costs = higher net returns |
None of these strategies is complicated. None of them requires predicting the market. None of them requires special knowledge or access. Together, they form a complete investment system that has outperformed the majority of professional investors over virtually every long-term period measured.
The Final Thought
The investors who lose over time are those who chase “hot” stocks, recently “best” mutual funds, and then panic and sell during adversity. The long-term winners control the one thing they can control — their investment costs — and have the discipline to endure short-term volatility while staying the course.
Patience and persistence are the key factors for success in investing. Not intelligence. Not access. Not timing. Patience, persistence, and the discipline to follow a sensible long-run plan.
Frequently Asked Questions
What are the most important elements of investing for beginners?
The 6 most important elements are: saving consistently, using low-cost index funds, diversifying broadly across asset classes and geographies, avoiding common behavioral mistakes, keeping the portfolio as simple as possible, and maintaining long-term discipline through volatile markets. Mastering these 6 principles will put you ahead of the majority of both amateur and professional investors.
How much should a beginner invest each month?
Start with whatever you can sustain without stopping. The Rule of 72 shows that time matters more than amount. Even $50 per month invested consistently for 40 years at 8% annual returns grows to roughly $175,000. $200 per month over 40 years becomes $700,000. Start small, automate it, increase contributions whenever income allows. Never pause contributions during market downturns — those are the months when your money buys the most shares at the best prices.
Is it better to invest a lump sum or spread it out monthly?
Lump sum investing outperforms dollar-cost averaging about two-thirds of the time when markets are rising. But dollar-cost averaging protects against investing at a peak, reduces the emotional difficulty of watching a large sum drop immediately after investing, and ensures you buy more shares during market downturns. For money that comes in as regular income, dollar-cost averaging is the only practical option. For lump sums, if you’re confident you can hold through an immediate decline, invest it all at once.
What is rebalancing and how often should you do it?
Rebalancing means periodically restoring your portfolio to its target allocation between stocks and bonds. If stocks have risen to represent 70% of your portfolio when your target is 60%, you sell some stocks and buy bonds. Once per year is the right frequency for most investors more frequent rebalancing creates unnecessary transaction costs and taxes. Do your rebalancing inside a tax-sheltered account (IRA or 401k) to avoid capital gains taxes.
Should beginners avoid stocks during a recession?
The opposite. Recessions cause stock prices to fall, which means you’re buying the same companies at a discount. Investors who stopped contributing to their 401k during the 2008-2009 recession missed buying at what turned out to be the lowest prices in a decade. The risk of selling during a recession is that you lock in your paper losses permanently and then typically buy back after prices have already recovered. Stay invested, keep contributing, and let the market work for you.
How do I know if a mutual fund is low-cost enough?
For US stock index funds, look for expense ratios under 0.05% annually. For international stock index funds, under 0.10%. For bond index funds, under 0.05%. Vanguard, Fidelity, and Schwab all offer excellent options in these ranges. Fidelity’s FZROX (US market) and FZILX (international) charge 0% annually. Any fund charging above 0.2% is expensive by modern standards.
About the Author — Jamaluddin K.A.
Jamaluddin is the founder of The First Time Investor, a US and UK-focused personal finance and investing education site. He writes about stock market fundamentals, investing principles, and wealth-building strategies for people who want to understand markets without a finance degree. Everything on this site is written from the belief that financial literacy should be accessible to everyone.
Disclosure: This article is for educational purposes only and does not constitute financial advice. All investing involves risk, including the loss of principal. Consult a licensed financial advisor before making investment decisions.